Tag: Q3 2025 Earnings

  • (105330) KNW Co., Ltd. Earnings Analysis: Deep Dive into Q3 2025 Losses & Future Stock Outlook

    (105330) KNW Co., Ltd. Earnings Analysis: Deep Dive into Q3 2025 Losses & Future Stock Outlook

    KNW Q3 2025 Earnings: Navigating Mounting Losses

    This comprehensive KNW Co., Ltd. earnings analysis delves into the recently announced preliminary Q3 2025 results, revealing a company at a critical crossroads. With persistent losses and an increasing financial burden, investors are cautiously evaluating whether KNW’s strategic investments in high-growth sectors like semiconductor materials can offset its current financial instability. This report dissects the numbers, explores the root causes, and provides a clear KNW stock outlook to help you make informed investment decisions.

    Breaking Down the Q3 2025 Financial Performance

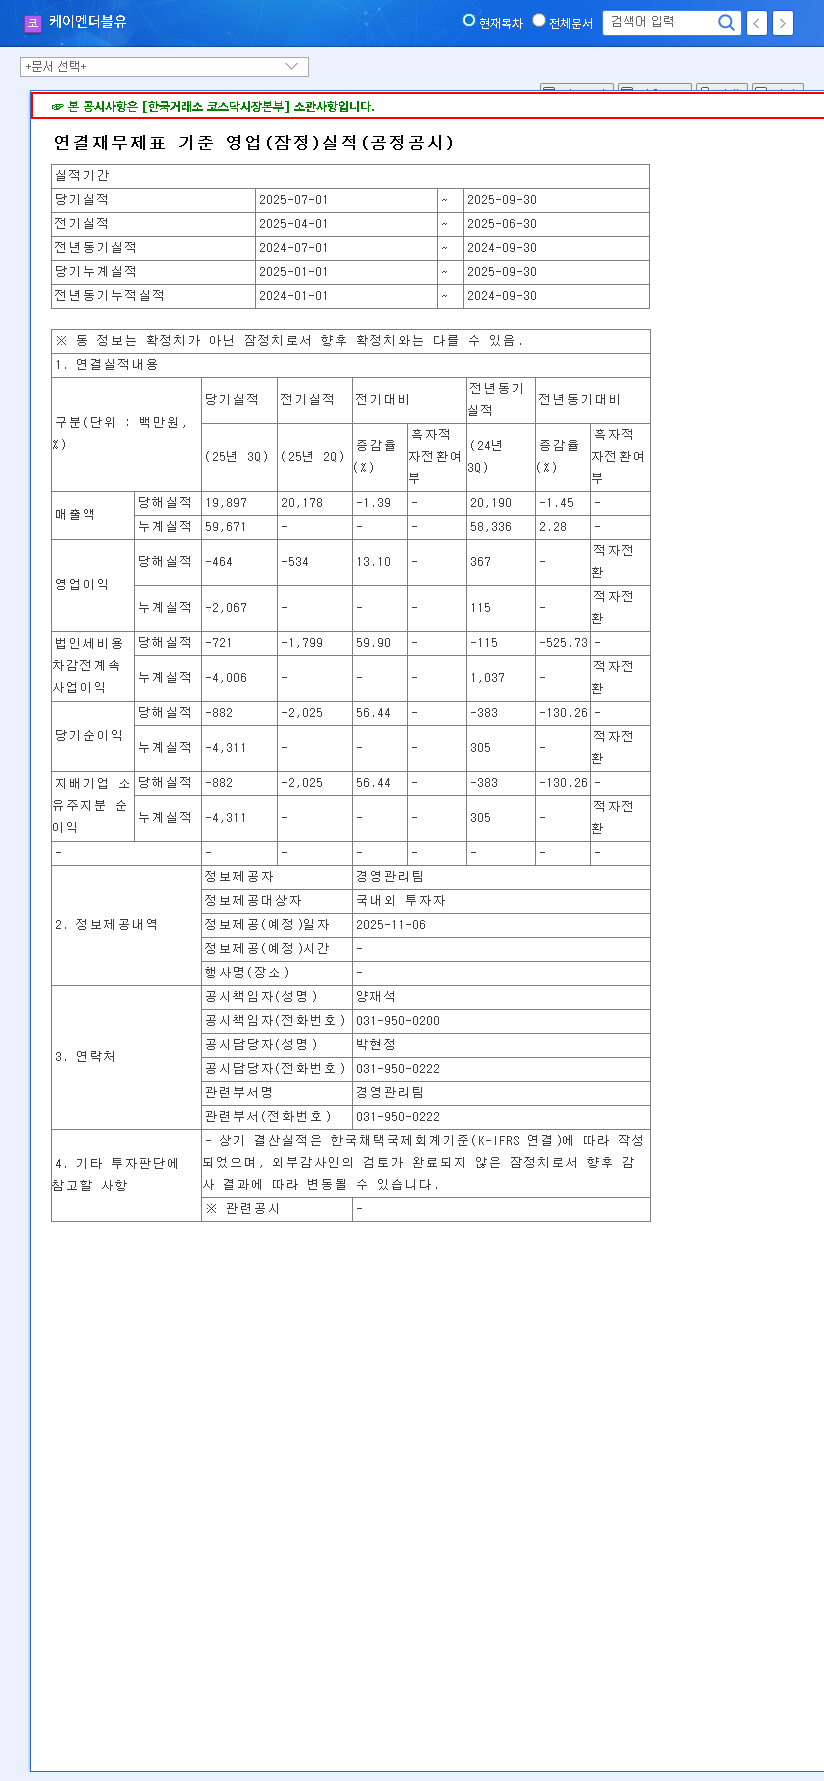
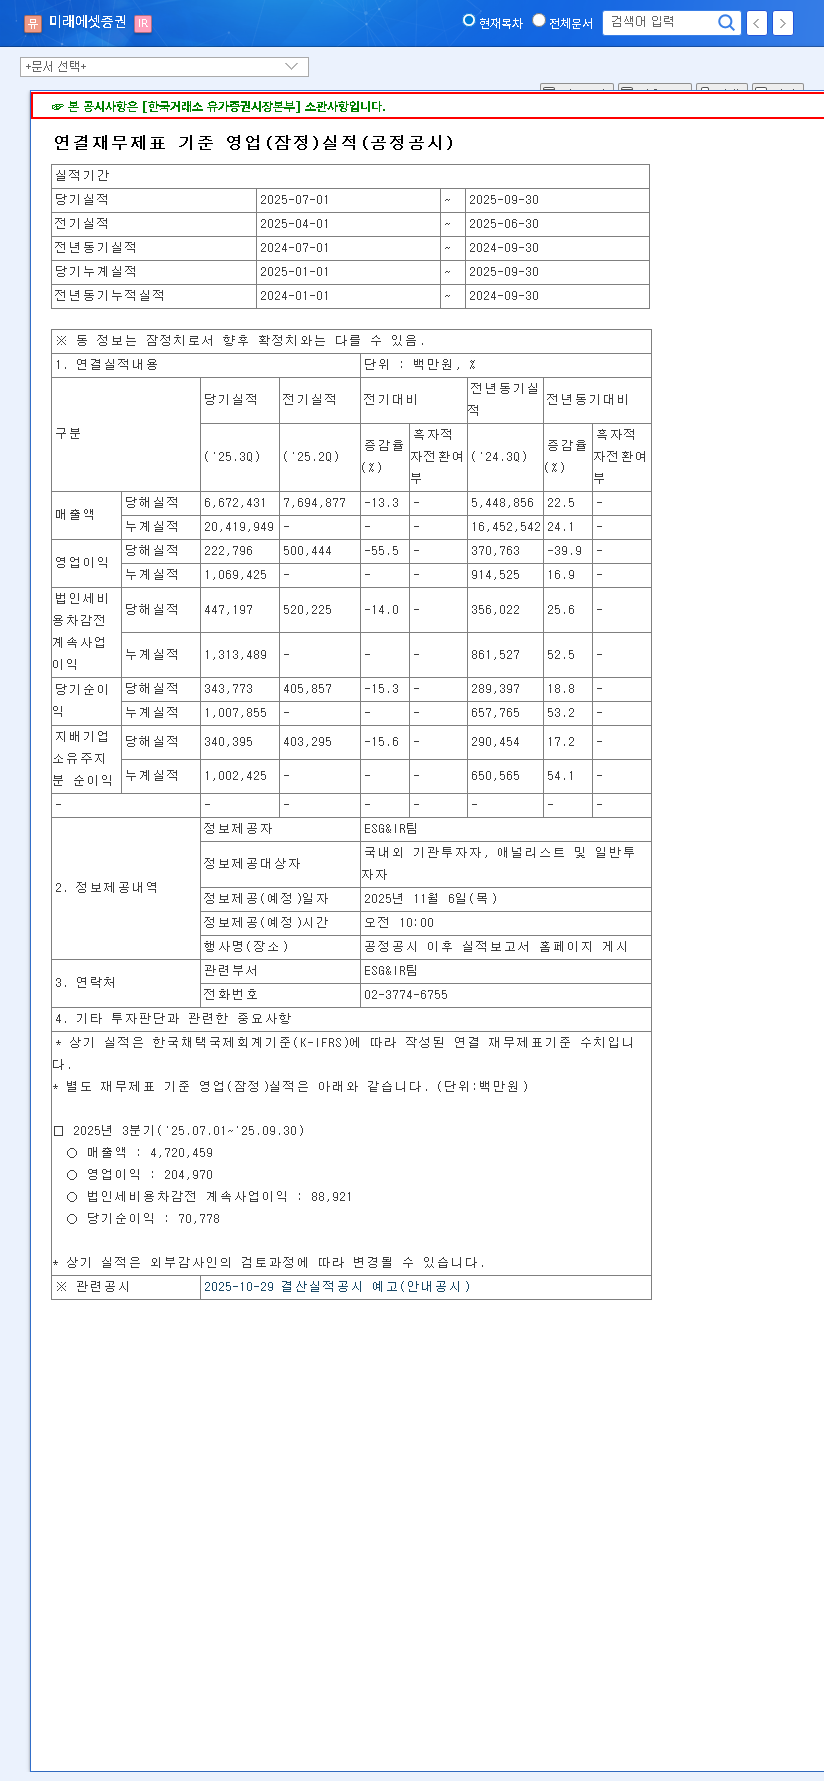
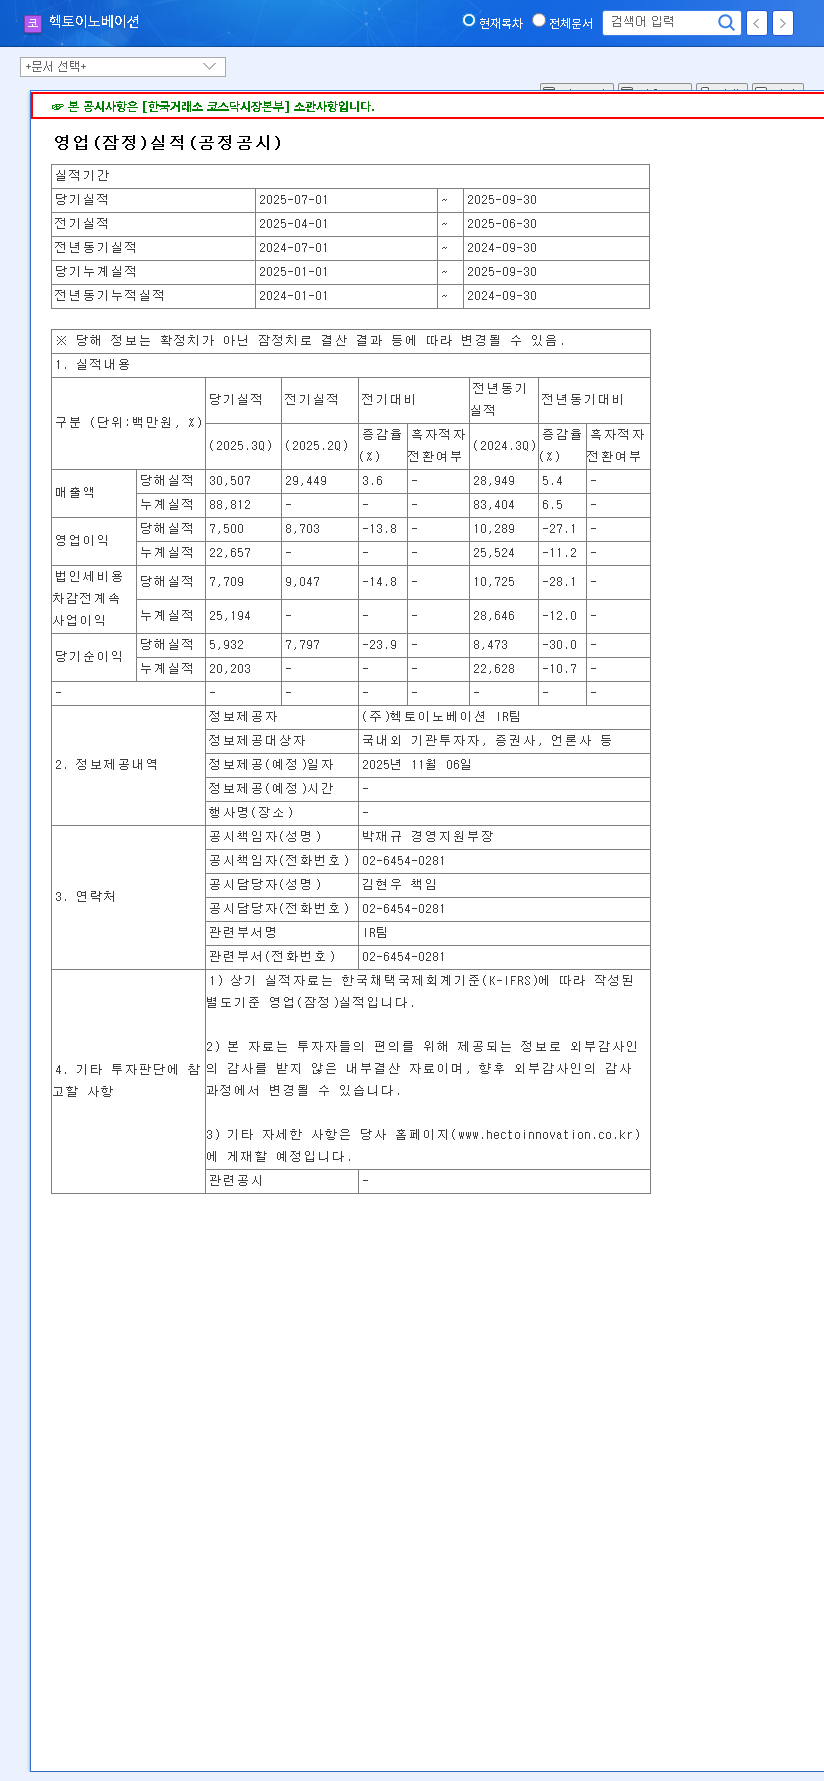
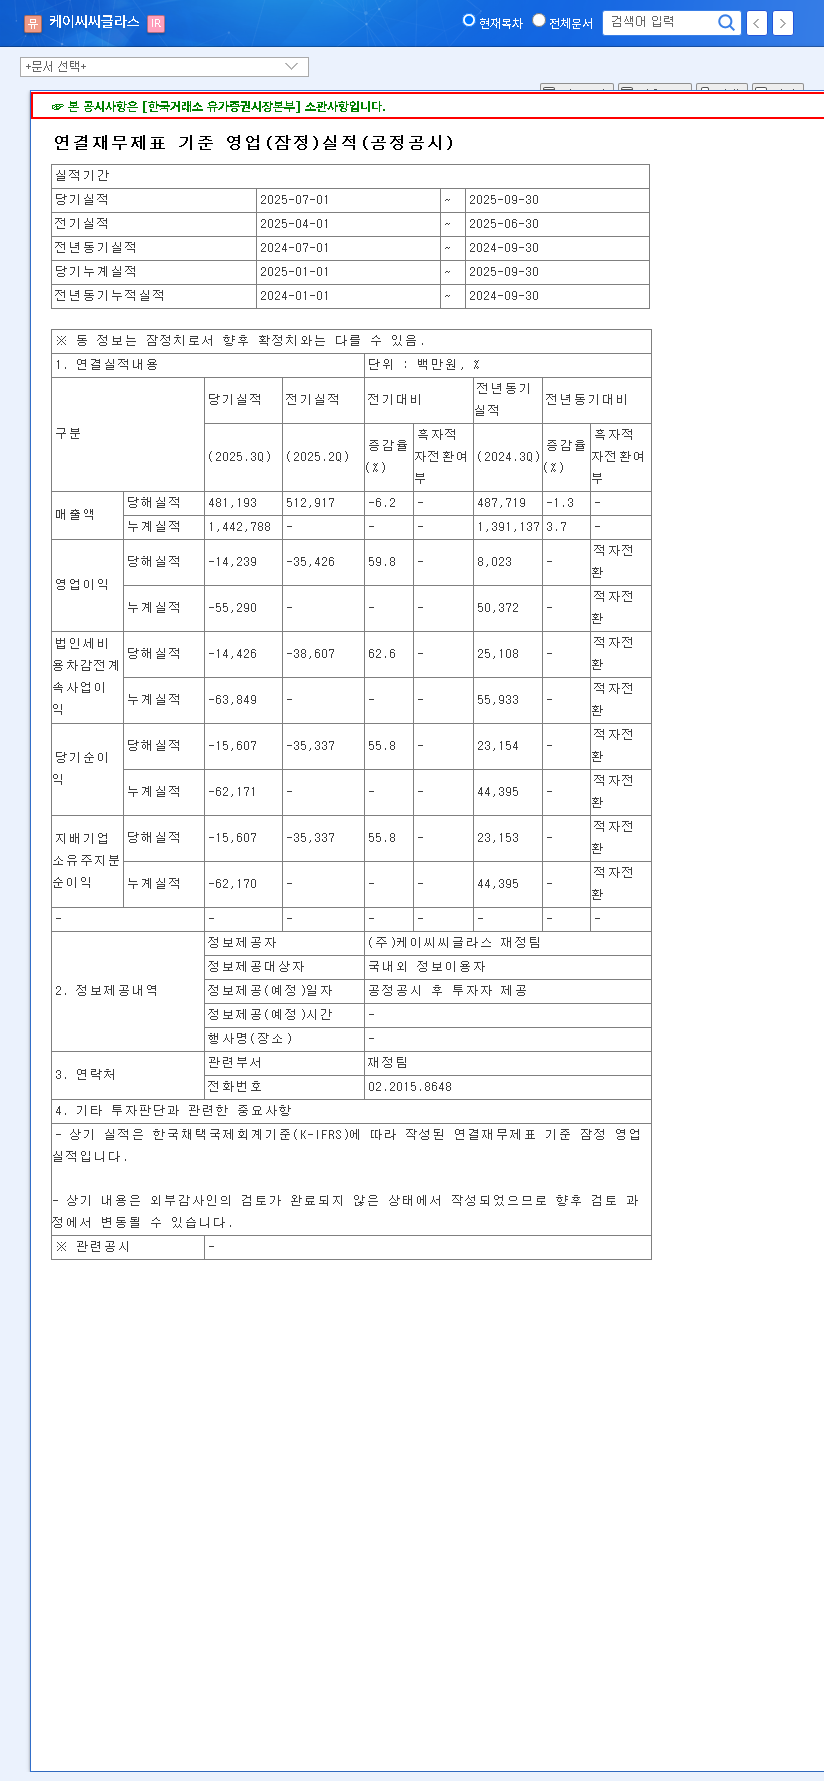
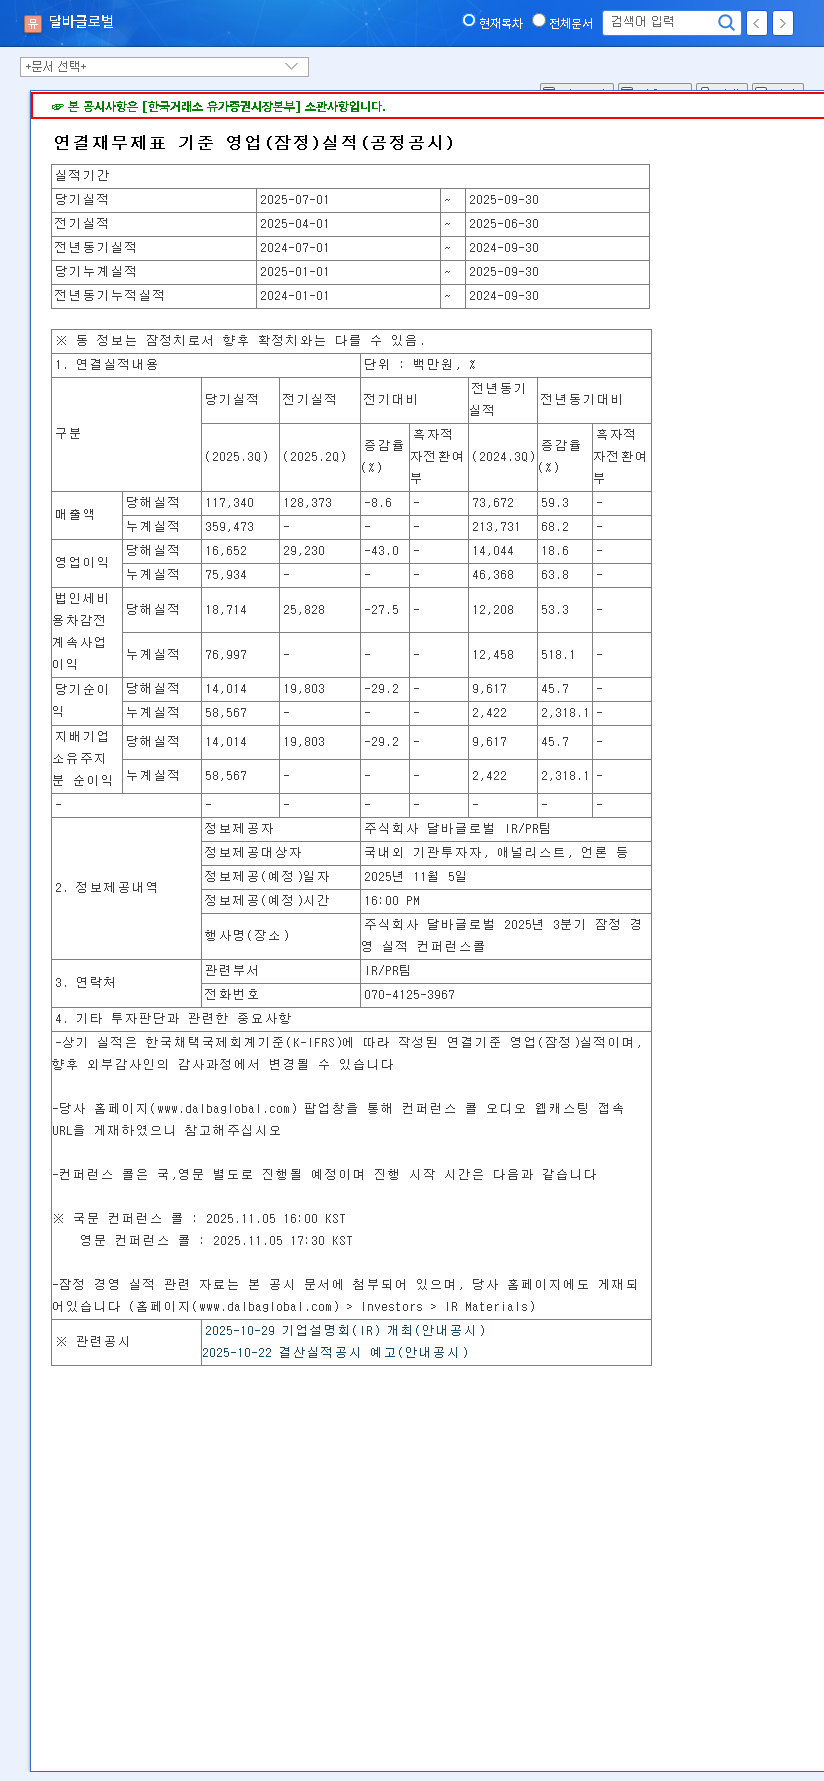
    KNW’s preliminary earnings for Q3 2025 paint a challenging picture. The company reported sales of KRW 19.9 billion, an operating loss of KRW 0.5 billion, and a net loss of KRW 0.9 billion. These figures, consistent with the losses from the previous quarter, confirm that the downward profitability trend that started in 2023 is not yet reversing. This data is based on the company’s official filing (Official Disclosure).

    The first half (H1) of 2025 already showed widening deficits compared to the prior year, with an operating loss of KRW 1.6 billion on sales of KRW 39.7 billion. While significant investments in future growth are evident from the -KRW 37.5 billion investing cash flow, the negative operating cash flow of -KRW 0.6 billion raises serious questions about the company’s core ability to generate cash from its primary business activities.

    The continuation of operating and net losses into Q3 2025 underscores a fundamental profitability issue that strategic investments have yet to resolve. This persistent burn rate is a primary concern for the current KNW stock outlook.

    Core Business Segments: A Double-Edged Sword

    A detailed KNW financial analysis requires looking at its individual segments. While diversified, each carries its own set of opportunities and risks that contribute to the company’s volatile performance.

    Semiconductor Materials: The High-Stakes Growth Engine

    Constituting nearly 62% of sales, this is KNW’s most critical division. Its strength lies in being Korea’s sole producer of SF6 special gas and its strategic investments in anhydrous hydrogen fluoride (AHF) facilities. These materials are vital for chip manufacturing. However, this heavy reliance makes KNW extremely vulnerable to the notoriously cyclical semiconductor industry and global supply chain disruptions. A downturn in chip demand directly impacts KNW’s top and bottom lines.

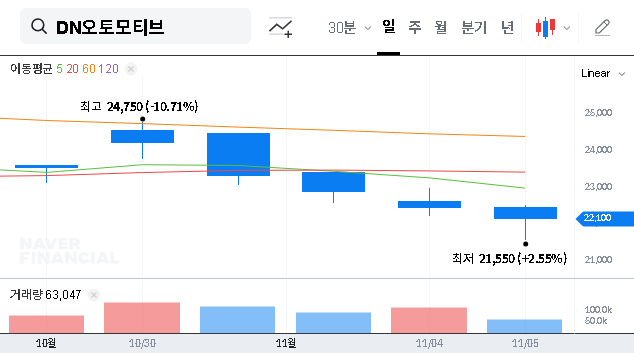
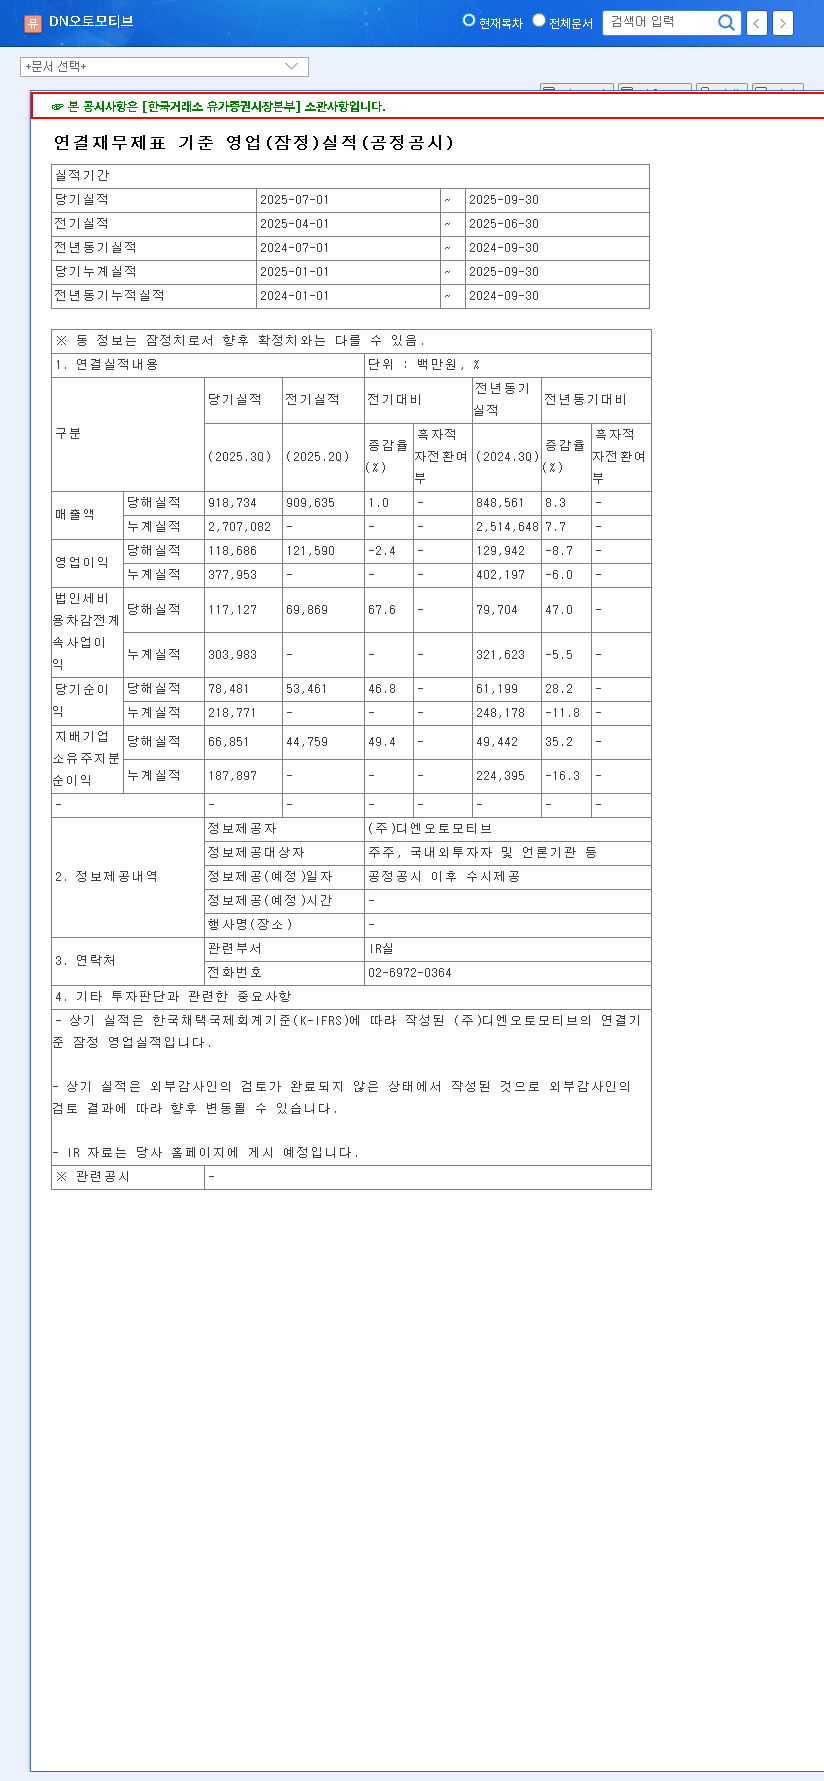
    Automotive & Electronic Parts: Stable but Vulnerable

    The automotive parts and electronic components segments provide a more stable revenue base, accounting for the remaining share. The growth of EVs and advanced technologies like 5G and AI presents significant opportunities. However, these markets are fiercely competitive, and performance is tied to the health of the broader automotive and consumer electronics industries, which are currently facing macroeconomic pressures.

    Decoding KNW’s Financial Health & Risk Factors

    The KRW 50 Billion Convertible Bond Burden

    A major red flag in the KNW financial analysis is the recent issuance of KRW 50 billion in convertible bonds. While this secures capital for investment, it introduces two major risks: future stock dilution for existing shareholders when bonds are converted to equity, and a heavier interest expense burden that will further erode net profits. For more details, see our guide to analyzing convertible bond risks.

    Macroeconomic Headwinds and Currency Exposure

    KNW is highly exposed to external economic forces. Global inflation, rising interest rates, and geopolitical instability can disrupt supply chains and dampen demand. Furthermore, the company’s significant exposure to USD and EUR exchange rate fluctuations is a key risk. A 10% swing in currency can materially impact net profit, yet the company has not implemented an aggressive hedging strategy, leaving its earnings vulnerable to volatility.

    Investor Action Plan & Final Recommendation

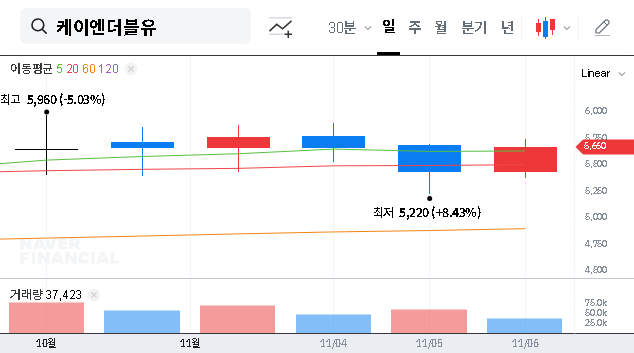
    Given the persistent profitability issues and rising financial risks highlighted in this KNW Co., Ltd. earnings analysis, the company’s fundamentals are currently assessed as negative. Short-term downward pressure on the stock price is highly likely to continue until tangible performance improvements are seen.

    Investors should adopt a cautious, observant stance rather than initiating new positions. Key factors to monitor closely include:

    • Profitability Turnaround: Any concrete evidence of margin improvement or a reduction in operating losses in the upcoming quarters.
    • Financial Management: Clear strategies to manage debt, control interest expenses, and mitigate the dilutive effect of convertible bonds.
    • Semiconductor Segment Performance: Signs that the investments in SF6 and AHF are translating into market share gains and profitable revenue.
    • Risk Mitigation: Implementation of a robust currency hedging strategy to protect earnings from exchange rate volatility.

    Until these areas show significant improvement, a wait-and-see approach is the most prudent course of action for investors considering KNW Co., Ltd.

    (105330) KNW Co., Ltd. Earnings Analysis: Deep Dive into Q3 2025 Losses & Future Stock Outlook 관련 이미지
  • (036010) ABCO ELECTRONICS Q3 2025 Earnings: A Deep Dive Analysis for Investors

    (036010) ABCO ELECTRONICS Q3 2025 Earnings: A Deep Dive Analysis for Investors

    The latest ABCO ELECTRONICS Q3 2025 earnings report has captured significant investor attention. As a key player specializing in electronic components, ABCO ELECTRONICS CO., LTD. (아비코전자) has signaled a continued recovery with steady revenue growth and sustained profitability. However, a deeper dive into the numbers reveals a nuanced picture with both promising opportunities and potential headwinds, particularly concerning its PCB business segment.

    This comprehensive ABCO ELECTRONICS analysis will dissect the Q3 2025 preliminary results, evaluate the performance of its core business units, and explore the macroeconomic factors shaping its future. Our goal is to provide investors with the clarity needed to make well-informed decisions in a complex market.

    Official Q3 2025 Preliminary Results: A Snapshot

    On November 6, 2025, ABCO ELECTRONICS announced its preliminary consolidated operating results. According to the Official Disclosure filed with DART, the key figures are as follows:

    • Revenue: KRW 34.7 billion (a 3.3% increase from Q2 2025)
    • Operating Profit: KRW 2.4 billion
    • Net Income: KRW 2.8 billion

    The consistent rise in revenue from the first to the third quarter indicates a healthy recovery trajectory. More importantly, the company has successfully maintained profitability, marking a significant turnaround compared to the previous year’s losses. This financial stabilization is a cornerstone of the current positive outlook for the company.

    While top-line revenue growth is encouraging, the slight quarter-over-quarter dip in operating profit demands closer scrutiny into segment-level performance and cost structures.

    Performance Drivers: A Segment-by-Segment Analysis

    The positive ABCO ELECTRONICS Q3 2025 earnings are not monolithic. The company’s strength lies in specific segments, while others face persistent challenges.

    The Powerhouse: Remarkable Recovery in Passive Components

    The ABCO passive components division continues to be the primary engine of growth. The 2025 semi-annual report showed this segment recording sales of KRW 31.1 billion, far outpacing other divisions. This performance is fueled by a broader market recovery and surging demand from high-growth industries like 5G infrastructure, Internet of Things (IoT) devices, and the rapidly expanding electric vehicle (EV) market. To capitalize on this momentum, ABCO is expected to double down on R&D and expand its product portfolio to maintain a competitive edge.

    The Challenge: Uncertainty in the PCB Business Segment

    In contrast, the ABCO PCB business faces headwinds. The semi-annual report highlighted a declining revenue trend, largely due to sluggishness in front-end industries that heavily rely on automotive PCBs. While the long-term outlook for automotive electronics remains strong, near-term production slowdowns have impacted demand. A key focus for investors should be ABCO’s strategy for diversifying its client base and navigating this temporary slump. For more context, you can read our guide on navigating the automotive semiconductor market.

    Financial Health and Macroeconomic Factors

    ABCO’s turnaround is remarkable, shifting from a consolidated operating loss of KRW -4.87 billion in 2024 to a profit of KRW 3.78 billion in the first half of 2025. This has significantly bolstered its financial health, evidenced by an improved debt-to-equity ratio and stronger operating cash flow. These metrics suggest a more resilient and fundamentally sound company.

    However, external macroeconomic pressures remain. The KRW/USD exchange rate, hovering around KRW 1,444, presents a double-edged sword. While a weaker Won benefits export revenue, it also increases the cost of imported raw materials. This currency volatility, combined with rising global energy prices, could impact profit margins if not managed carefully. The global economic climate, as reported by sources like Reuters, suggests that supply chain efficiency and cost control will be critical in the coming quarters.

    Investor Outlook: Opportunities & Action Plan

    The ABCO ELECTRONICS analysis reveals a company in a solid recovery phase, but with clear areas that warrant investor vigilance.

    Key Points for Investors to Monitor:

    • Segment-Specific Profitability: Scrutinize the detailed Q3 report once available to understand the precise profit margins of the passive components versus the PCB business. Is the former strong enough to offset the latter’s weakness?
    • PCB Recovery Strategy: Look for management commentary on plans to revitalize the PCB segment. This could include new customer acquisitions, entry into new markets, or technological advancements.
    • Competitive Landscape: Assess how the ABCO passive components division is faring against its key competitors. Sustaining market share and innovation is crucial for long-term growth.

    In conclusion, while the headline numbers from the ABCO ELECTRONICS Q3 2025 earnings are positive, the underlying details suggest a period of strategic transition. The company’s ability to maintain its momentum in passive components while engineering a turnaround in its PCB division will determine its stock performance in the medium to long term. The current stability is promising, but proactive monitoring of the factors above is essential.

    Disclaimer: This analysis is based on preliminary figures and publicly available data. It is not intended as financial advice. All investment decisions should be made at the investor’s own discretion and responsibility.

    (036010) ABCO ELECTRONICS Q3 2025 Earnings: A Deep Dive Analysis for Investors 관련 이미지
  • (006800) Mirae Asset Securities Q3 2025 Earnings: A Deep Dive into Profit Miss & Stock Outlook

    (006800) Mirae Asset Securities Q3 2025 Earnings: A Deep Dive into Profit Miss & Stock Outlook

    The latest Mirae Asset Securities Q3 2025 earnings report, released on November 6, 2025, has sent a mixed message to the market, leaving investors to decipher a complex financial narrative. The preliminary results revealed a significant miss on operating profit against market consensus, yet simultaneously delivered a surprising beat on net income. This dichotomy raises critical questions about the company’s underlying health and future trajectory.

    This comprehensive Mirae Asset Securities earnings analysis will dissect these contrasting figures, explore the macroeconomic pressures at play, and provide a clear, actionable investment strategy for stakeholders evaluating their position in Mirae Asset Securities stock.

    Q3 2025 Earnings: The Official Numbers

    According to the company’s preliminary filing, the key financial metrics for the third quarter of 2025 are as follows. For a complete breakdown, investors can review the Official Disclosure on DART.

    • Revenue: KRW 6,672.4 billion (a 22.5% increase YoY)
    • Operating Profit: KRW 222.8 billion (a staggering 45.0% miss vs. market expectations)
    • Net Income: KRW 340.4 billion (a solid 12.4% beat vs. market expectations)

    The central puzzle of the Q3 2025 earnings is this: How did core operational profitability decline so sharply while the final net income remained robust? The answer lies in the details beyond the headlines.

    Unpacking the Discrepancy: Profit Miss vs. Income Beat

    Factors Behind the Operating Profit Decline

    The 45% shortfall in operating profit is the primary concern for the market. This figure reflects the core business’s health, and a miss of this magnitude suggests significant headwinds. Potential causes include a combination of internal and external factors:

    • Increased Operating Expenses: A surge in costs, perhaps related to new technology investments, marketing campaigns, or one-time provisions for potential losses, could have eroded profits.
    • Market Volatility: The securities industry is highly sensitive to market conditions. As noted in reports by major financial outlets like Bloomberg, increased interest rate and currency volatility (e.g., rising KRW/USD exchange rate) can compress trading margins and reduce fee income from investment banking (IB) activities.
    • Dampened Investor Sentiment: A cautious market environment often leads to lower trading volumes and reduced demand for financial products, directly impacting a securities firm’s primary revenue streams.

    The Silver Lining in Net Income

    Conversely, the outperformance in net income suggests robust non-operating activities. Net income is calculated after accounting for non-operating gains/losses and taxes. The positive result likely stemmed from:

    • Gains on Financial Assets: Successful valuation gains on long-term investments or equity holdings can significantly boost the bottom line, even if core operations struggle.
    • Favorable Foreign Exchange Movements: While currency volatility can hurt operations, it can also create gains on foreign-denominated assets held by the company.
    • Tax-Related Adjustments: One-off corporate tax effects or refunds can also contribute to a stronger-than-expected net income figure.

    Future Outlook and Investor Action Plan

    While the short-term market reaction to the operating profit miss may be negative, a mid-to-long-term perspective requires a more nuanced approach. Investors should focus on the following key areas when evaluating the Mirae Asset Securities Q3 2025 earnings and planning their next steps.

    Key Points for Investors to Monitor

    • Analyze the Full Report: Wait for the detailed earnings report to clarify the exact reasons for the operating profit decline. Determine if the causes are one-time events or indicative of a structural weakness in the business model.
    • Track Growth Initiatives: Pay close attention to the progress of Mirae Asset’s strategic initiatives, such as its ventures into AI-powered asset management and tokenized securities (STOs). The success of these future growth engines is critical for long-term value creation. For more context, you can read our guide on diversification in financial services.
    • Evaluate Shareholder Returns: Monitor the company’s commitment to its shareholder return policy. Consistent dividends and share buyback programs can provide a buffer and enhance investment appeal, even during periods of operational volatility.
    • Monitor Macro Trends: Keep a close eye on key macroeconomic indicators. The path of global interest rates, currency fluctuations, and overall economic health will continue to be the primary drivers of performance in the securities sector.

    In conclusion, the Q3 2025 results present a complex picture. The weakness in core operations is a clear red flag that warrants caution. However, the resilient net income and the company’s forward-looking strategies provide a basis for cautious optimism. A prudent investor will dig deeper into the forthcoming detailed report before making any significant adjustments to their investment strategy regarding Mirae Asset Securities stock.

    (006800) Mirae Asset Securities Q3 2025 Earnings: A Deep Dive into Profit Miss & Stock Outlook 관련 이미지
  • (007070) GS Retail Q3 2025 Earnings: Stock Soars on 52% Profit Beat – Full Analysis

    (007070) GS Retail Q3 2025 Earnings: Stock Soars on 52% Profit Beat – Full Analysis

    The latest GS Retail Q3 2025 earnings report has captured significant market attention, revealing a performance that dramatically outpaced analyst expectations. With a stunning net profit beat of over 52%, GS Retail Co.,Ltd (KRX: 007070) has demonstrated exceptional strength in its core operations and strategic management. This report offers a comprehensive analysis of the factors driving this success, breaking down the segmental performance, assessing macroeconomic influences, and providing a forward-looking investment outlook on the future of GS Retail stock.

    GS Retail delivered an astonishing earnings surprise for Q3 2025, with an operating profit of KRW 111.1 billion and a net profit of KRW 94.5 billion, showcasing robust growth and a significant enhancement in profitability that signals strong fundamental health.

    Unpacking the Q3 Earnings Surprise

    GS Retail’s consolidated results for the third quarter of 2025 were nothing short of impressive. The company reported sales of KRW 3.2054 trillion, which slightly exceeded market forecasts by 2.4%. However, the real story lies in the profitability metrics, which were the primary drivers behind the GS Retail earnings surprise.

    • Operating Profit: Reached KRW 111.1 billion, surpassing market expectations by a significant 17.6%. This indicates highly effective cost management and operational efficiency, even amidst a competitive landscape.
    • Net Profit: Soared to KRW 94.5 billion, exceeding consensus estimates by a remarkable 52.7%. This substantial beat suggests strong core performance and potentially favorable one-off factors, such as reduced impairment losses on investments.

    This robust performance is a testament to the consistent growth engine of its convenience store business and a company-wide focus on optimizing the cost structure. Investors have taken notice, as these figures signal a fundamental improvement in the company’s financial health and competitive positioning.

    Core Business Deep Dive: Segment Performance

    A closer look at GS Retail’s individual business segments reveals a mixed but overall positive picture, with the convenience store division leading the charge.

    Convenience Store (GS25): The Unwavering Growth Engine

    The GS25 convenience store chain remains the jewel in GS Retail’s crown. Capitalizing on the societal shift towards single-person households and the preference for local shopping, the segment saw steady growth in both store count and sales. Innovations in product offerings and the introduction of new services continue to bolster its competitive edge. While market saturation and rising labor costs are persistent concerns, the Q3 results demonstrate a clear ability to manage these challenges effectively.

    Supermarket (GS THE FRESH) & Home Shopping (GS SHOP)

    The supermarket division, GS THE FRESH, is navigating a fiercely competitive market. While benefiting from similar trends as the convenience stores, growth is tempered by regulations and price wars. The company’s focus on differentiated strategies like quick commerce is a positive step. Meanwhile, the GS SHOP home shopping segment faces structural headwinds from declining TV viewership. However, its aggressive pivot towards digital channels, including mobile and live commerce, is a crucial move to secure future relevance and profitability.

    Development Business & Subsidiaries

    Uncertainty in the real estate market poses a significant challenge for the development business. Rising interest rates and construction costs could continue to pressure this segment’s profitability. On a strategic level, the decision to discontinue certain overseas operations, while causing a short-term dip, is a smart long-term play to refocus capital and management attention on core, high-performing domestic businesses.

    Investment Outlook: Is GS Retail Stock a Buy?

    The exceptional GS Retail Q3 2025 earnings report provides a strong bullish signal for investors. The positive momentum is expected to attract renewed interest in the stock. For a broader market perspective, it’s often helpful to consult analysis from leading financial news sources like Bloomberg.

    Potential Upside (Investment Opinion: Positive)

    • Short-Term Momentum: The earnings surprise is a powerful catalyst that is likely to drive the stock price higher in the near term as the market digests the positive news.
    • Mid- to Long-Term Strength: The stable growth of the convenience store business, combined with proven cost management and digital transformation efforts, provides a solid foundation for sustained value creation. The KRX: 007070 performance outlook is strong.

    Key Risks to Monitor

    Despite the positive outlook, investors should remain vigilant. The stellar Q3 performance sets a high bar for the future, and any failure to meet these elevated expectations could lead to a correction. Furthermore, macroeconomic headwinds, such as exchange rate volatility or a deeper economic slowdown, and the lingering structural weaknesses in the home shopping and development segments require continuous monitoring. For more context, you can read our guide to investing in the Korean retail sector.

    For those wishing to verify the official numbers, the company’s filing can be reviewed directly. Official Disclosure: Click to view DART report.

    In conclusion, GS Retail’s Q3 2025 performance is a clear indicator of a company firing on all cylinders. The combination of market leadership in its core segment and disciplined financial management paints a compelling picture for a positive investment thesis, contingent on careful monitoring of the outlined risks.

    (007070) GS Retail Q3 2025 Earnings: Stock Soars on 52% Profit Beat – Full Analysis 관련 이미지
  • (214180) Hecto Innovation Q3 2025 Earnings Analysis: Stock Impact & Long-Term Growth

    (214180) Hecto Innovation Q3 2025 Earnings Analysis: Stock Impact & Long-Term Growth

    The recent Hecto Innovation Q3 2025 earnings report, released on November 6, 2025, has sent ripples through the investment community. The company announced preliminary results that fell significantly short of market consensus, raising critical questions about its short-term trajectory and stock performance. While the immediate outlook appears challenging, a deeper analysis reveals a company at a crossroads, balancing a temporary setback against a robust long-term growth strategy rooted in business diversification. This report offers a comprehensive Hecto Innovation analysis, exploring the implications of the earnings miss, the underlying fundamentals of its core divisions, and what investors should monitor moving forward.

    Unpacking the Hecto Innovation Q3 2025 Earnings Miss

    Hecto Innovation’s preliminary Q3 2025 financial disclosure revealed a notable underperformance across key metrics: revenue, operating profit, and net income all landed substantially below market expectations. This “earnings miss” creates immediate uncertainty. While specific analyst forecasts weren’t consolidated in the announcement, the deviation from the company’s own guidance signals a significant gap between anticipated and actual performance. For detailed figures and the official filing, you can view the Official Disclosure on DART. This shortfall is the primary catalyst for the expected short-term pressure on the Hecto Innovation stock.

    An earnings miss can temporarily erode investor confidence, but it also prompts a crucial re-evaluation of a company’s fundamental value and long-term strategic direction. The key is to distinguish between a temporary stumble and a structural problem.

    Strategic Pillars: A Look at Hecto’s Diversified Portfolio

    Despite the Q3 headwinds, Hecto Innovation’s strategy, outlined in its H1 2025 report, remains focused on building resilient growth engines through diversification across key technology sectors. Understanding these pillars is essential for assessing the company’s long-term potential.

    IT Information Services Division

    This division has shown remarkable profitability, maintaining a high operating profit margin of 60.3% in H1 despite a revenue decline. This indicates strong cost control and operational efficiency. Future growth hinges on the ‘Ballosodeuk’ app’s user acquisition, the expansion of its MyData business, and a clear strategy for global market entry.

    FinTech Division

    The FinTech arm provides a stable revenue base with significant growth potential, particularly within the burgeoning simple cash payment market. Key strengths include robust system stability and security infrastructure. Expanding its footprint in public institution payment services further solidifies its market position. For more on this sector, read our overview of The Future of FinTech in South Korea.

    Healthcare Division

    While facing a temporary revenue dip, the Healthcare division is positioned in a high-growth market. Its competitive product lineup, featuring brands like ‘DeSimone’, combined with ongoing development of an integrated IT healthcare platform, points to strong future synergies. Managing sales of high-priced products amid economic shifts remains a key challenge.

    Market Impact and Investor Outlook

    Short-Term Volatility (1-3 Months)

    The immediate aftermath of the Hecto Innovation Q3 2025 earnings miss will likely be negative.

    • Downward Stock Pressure: The underperformance will almost certainly dampen investor sentiment, leading to selling pressure and potential price declines.
    • Heightened Scrutiny: Investors and analysts will raise doubts about future earnings, demanding more clarity from management in the upcoming earnings call.
    • Potential for Program Selling: Automated trading systems and institutional investors may trigger sell-offs based on the negative earnings surprise.

    Mid- to Long-Term Potential (3-12+ Months)

    Looking beyond the immediate noise, the focus shifts to the company’s ability to execute its long-term vision. The Hecto Innovation growth story is not derailed by one quarter. The market will be watching for a fundamental re-evaluation based on the performance of its growth engines. The company’s resilience against global macroeconomic trends and its commitment to shareholder value through policies like share buybacks will be critical in rebuilding investor trust.

    Actionable Insights for Investors

    While the short-term outlook is cautious, long-term investors should focus on the execution of Hecto Innovation’s diversification strategy. Key areas to monitor include:

    • Forward Guidance: Scrutinize the Q4 and full-year 2026 outlook for signs of recovery.
    • New Business Traction: Look for tangible metrics on the performance of ‘Ballosodeuk’ and the IT-healthcare platform.
    • Profitability Measures: Assess the company’s efforts in cost control and efficiency to protect margins.
    • Shareholder Policies: Confirm the continuation of shareholder-friendly actions like share buybacks and cancellations.

    In summary, the disappointing Hecto Innovation financials for Q3 2025 warrant a cautious approach. Investors may consider waiting for the next earnings cycle for confirmation of a turnaround before making significant investment decisions.

    Frequently Asked Questions (FAQ)

    Q1: What was the main takeaway from Hecto Innovation’s Q3 2025 earnings?

    A1: Hecto Innovation’s preliminary Q3 2025 earnings significantly missed market expectations across revenue, operating profit, and net income, creating short-term negative sentiment for the stock.

    Q2: How might this earnings miss affect the stock price in the short term?

    A2: The stock is likely to face increased downward pressure due to weakened investor confidence. This could trigger profit-taking or automated program selling in the immediate future.

    Q3: What are Hecto Innovation’s key long-term growth drivers?

    A3: The company’s long-term growth hinges on its diversified business strategy, including the ‘Ballosodeuk’ app in IT, expansion in the FinTech payment market, and the synergy between IT and Healthcare platforms.

    Q4: How is Hecto Innovation’s financial stability?

    A4: Despite the recent profit decline, the company’s H1 2025 report indicated strengthened financial stability with an increase in cash and cash equivalents, which provides a buffer against market volatility.

    Disclaimer: This analysis is based on publicly available information and is not financial advice. All investment decisions should be made based on your own research and risk tolerance.

    (214180) Hecto Innovation Q3 2025 Earnings Analysis: Stock Impact & Long-Term Growth 관련 이미지
  • (234340) Hecto Financial Q3 2025 Earnings Analysis: Decoding the Surprise Profit Surge

    (234340) Hecto Financial Q3 2025 Earnings Analysis: Decoding the Surprise Profit Surge

    The latest Hecto Financial Q3 2025 earnings report, released on November 6, 2025, has presented investors with a classic financial puzzle. Despite revenues falling short of market expectations, the company posted operating and net profits that significantly surpassed forecasts, delivering a powerful ‘earnings surprise‘. This seemingly contradictory result raises crucial questions: What does this signal about the company’s operational health, and how should investors adjust their strategy for Hecto Financial stock? This in-depth investment analysis will delve beyond the headline numbers to explore the fundamentals, market dynamics, and future outlook for this prominent fintech player.

    The Q3 2025 Earnings Report by the Numbers

    To understand the context of the Hecto Financial earnings surprise, it’s essential to examine the key performance indicators. The official figures, as per the Official Disclosure on DART, reveal a fascinating split between top-line growth and bottom-line profitability.

    • Revenue: KRW 40 billion, which was 13.0% below the market consensus forecast of KRW 45.9 billion.
    • Operating Profit: KRW 5.1 billion, a significant 21.4% above the forecast of KRW 4.2 billion.
    • Net Profit: KRW 4.5 billion, coming in 15.4% higher than the projected KRW 3.9 billion.

    This data clearly illustrates that while the company struggled with sales growth during the quarter, it excelled in managing its operations and converting its revenue into actual profit.

    Unpacking the Profit Beat: Why Did Profits Climb?

    An increase in profitability alongside a revenue decline often points to significant improvements in operational efficiency. While the preliminary report doesn’t specify every detail, we can infer several likely drivers behind this fintech earnings report‘s positive surprise:

    • Effective Cost Management: The company likely implemented rigorous cost-cutting measures, optimizing its spending on marketing, administration, or R&D without hampering core profit-generating activities.
    • Favorable Product/Service Mix: Hecto Financial may have seen a strategic shift in sales towards higher-margin services. For example, a greater contribution from its data business or specialized payment platform solutions could have boosted overall profitability even on lower total revenue.
    • Subsidiary Performance: Strong performance from one of its incorporated subsidiaries could have contributed significantly to consolidated profits, offsetting weaker performance in other areas.

    A Closer Look at Hecto Financial’s Fundamentals

    The Q3 2025 results are a snapshot in time, but they reflect a broader trend. After a deficit in Q4 2024, Hecto Financial has demonstrated a steady recovery in operating and net profits. This suggests a successful strategic pivot towards profitability. Here’s a breakdown of the company’s core strengths and risks.

    Core Strengths and Opportunities

    • Solid Financial Foundation: The company boasts a stable financial structure with high cash reserves, providing a buffer against market volatility and funding for new ventures.
    • Growth in New Ventures: Strategic investments in high-potential areas like data analytics, MyData services, and Security Token Offerings (STO) position the company to capitalize on key fintech trends.
    • Technological Edge: Deep expertise in operating complex financial systems gives Hecto Financial a competitive advantage in a crowded market.

    Considerations and Risk Factors

    • Slowing Revenue Growth: The Q3 revenue decline is a concern. If this trend continues, it could signal market saturation or intensifying competition, limiting long-term expansion.
    • Investment Asset Impairment: Potential losses from investment assets could negatively impact future profitability and offset the gains made in operational efficiency.
    • Monetization Timeline: The success of new ventures is not guaranteed and requires significant time and capital to achieve profitability.

    Investment Strategy for Hecto Financial Stock

    Given the mixed signals from the Hecto Financial Q3 2025 earnings, a nuanced investment approach is required. The positive earnings surprise is likely to provide a short-term boost to investor sentiment and the stock price.

    As one market analyst noted, “An earnings surprise is a powerful short-term catalyst, but savvy investors will look for a return to sustained revenue growth as the ultimate sign of long-term health and market leadership.”

    For a deeper understanding of these financial metrics, resources like Investopedia’s guide to earnings reports can be invaluable. From a strategic perspective, investors should consider both short-term momentum and long-term viability.

    Short-Term Outlook

    Traders might capitalize on the positive momentum following the announcement. However, caution is advised. The underlying revenue weakness and potential investment risks mean that this upward trend could be fragile.

    Mid-to-Long-Term Outlook

    Long-term investors should focus on whether Hecto Financial can reignite its top-line growth. Key indicators to watch in future quarters include the revenue trend, progress in monetizing new data and STO businesses, and the performance of investment assets. Success in these areas, combined with continued profitability, would build a strong case for long-term value. For a broader market view, consider comparing this performance with our analysis of top fintech stocks to watch in 2026.

    Disclaimer: This report is for informational purposes only and is based on publicly available information. It does not constitute financial advice. All investment decisions must be made at the investor’s own discretion and responsibility.

    (234340) Hecto Financial Q3 2025 Earnings Analysis: Decoding the Surprise Profit Surge 관련 이미지
  • (344820) KCC GLASS Corporation Q3 2025 Earnings: In-Depth Analysis & Stock Outlook

    (344820) KCC GLASS Corporation Q3 2025 Earnings: In-Depth Analysis & Stock Outlook

    The latest KCC GLASS Corporation Q3 2025 earnings report, released on November 5, 2025, has sent mixed signals to the market. While the company grapples with persistent losses and a challenging macroeconomic environment, a slight outperformance in operating profit against bleak forecasts offers a sliver of hope. For investors evaluating KCC GLASS Corporation stock, this report demands a nuanced interpretation. This in-depth analysis unpacks the critical figures, explores the underlying causes, and provides a clear investment outlook for the road ahead.

    Facing a downturn in the domestic construction market and escalating raw material costs, the company’s path to profitability is fraught with challenges. We will examine the performance of its core segments, assess its financial health, and identify the key catalysts and risks that investors must monitor closely.

    KCC GLASS Corporation Q3 2025 Earnings: The Headline Figures

    The provisional third-quarter KCC financial report presented a complex picture. Here’s a breakdown of the key performance indicators compared to market consensus, based on the Official Disclosure:

    • Revenue: KRW 481.2 billion, falling 3% short of the market expectation of KRW 497.7 billion.
    • Operating Profit: A loss of KRW -14.2 billion, which, while negative, was 10% better than the forecasted loss of KRW -15.8 billion.
    • Net Profit: A significant loss of KRW -15.6 billion, confirming a shift into the red for the bottom line.

    The revenue miss highlights the ongoing demand weakness, particularly from the construction sector. However, the better-than-feared operating loss suggests that some internal cost control measures may be starting to take effect, or that the market’s pessimism was slightly overblown. Nevertheless, the overarching theme remains one of financial pressure.

    Fundamental Analysis: Why is Profitability Worsening?

    The Q3 results are not an anomaly but a continuation of a trend seen in the first half of 2025, where the company recorded a company-wide operating loss of KRW 41.1 billion. The core issues are multifaceted, stemming from both internal segment dynamics and external market forces.

    The Glass Segment: Hit by Construction Slump

    The primary drag on performance is the glass division. A slowdown in domestic construction and real estate development has directly reduced demand for architectural glass. This has been compounded by increased price competition from low-cost imports, squeezing margins and leading to an expanded operating loss for the segment. This is a critical area for any KCC investment analysis.

    Interior & Distribution: A Story of Unprofitable Growth

    Conversely, the interior and distribution segments saw impressive revenue growth of nearly 22%. However, this growth came at a steep price, with operating profit in this division falling by over 45%. This indicates that the company is spending heavily to capture market share in a fiercely competitive environment, with increased marketing costs and investments eroding profitability.

    The core dilemma for KCC GLASS Corporation is balancing top-line growth in its interior segment with the urgent need to stabilize its core glass business and restore overall profitability in a high-cost, low-demand environment.

    Macroeconomic and Financial Headwinds

    The company’s performance is intrinsically linked to broader economic trends. High interest rates, set by the Bank of Korea at 2.50%, increase the financing costs for KCC’s substantial liabilities (KRW 948.8 billion as of H1 2025) and dampen construction activity. Furthermore, as noted by leading financial analysts at Reuters, global supply chain pressures and volatile energy prices directly impact raw material costs for glass manufacturing. The high KRW/USD exchange rate (1,444.00) is a double-edged sword: it helps export competitiveness but inflates the cost of imported raw materials.

    A crucial variable for future growth is the performance of its overseas operations, particularly the new plant in Indonesia. Stabilizing this facility and expanding export sales could provide a much-needed buffer against domestic market weakness. For more on this, you can read our analysis on the global manufacturing outlook.

    Investment Strategy and Key Considerations

    Given the KCC GLASS Corporation Q3 2025 earnings, our investment opinion remains ‘Neutral.’ The persistent losses and revenue miss are likely to weigh on the stock price in the short term. However, long-term investors should watch for signs of a turnaround. Positive catalysts could emerge from a recovery in the construction market or clear evidence that the company’s cost-cutting and efficiency strategies are yielding tangible results.

    Investor Action Plan: What to Monitor

    • Construction Market Indicators: Closely track housing starts, construction permits, and real estate market sentiment in South Korea.
    • Profit Margin Trends: Look for sequential improvement in operating and net profit margins in subsequent quarterly reports.
    • Overseas Performance: Monitor news related to the Indonesian plant’s production levels, efficiency, and export sales figures.
    • Management Commentary: Pay attention to the company’s forward-looking statements on cost management, debt reduction, and strategic priorities.

    (344820) KCC GLASS Corporation Q3 2025 Earnings: In-Depth Analysis & Stock Outlook 관련 이미지
  • (003520) YUNGJIN PHARM. Q3 2025 Earnings Analysis: Zero Profit & Red Alert for Investors

    (003520) YUNGJIN PHARM. Q3 2025 Earnings Analysis: Zero Profit & Red Alert for Investors

    The recent preliminary report on YUNGJIN PHARM. Q3 2025 earnings has sent shockwaves through the investment community. After a promising 2024, the company reported a stark decline in revenue, a complete evaporation of operating profit to zero, and a troubling shift to a net loss. This abrupt reversal has left many investors questioning the company’s stability and future prospects.

    What caused this dramatic downturn? Is this a temporary setback or a sign of deeper, systemic issues? In this comprehensive analysis, we will dissect the YUNGJIN PHARM. Q3 2025 earnings report, explore the underlying financial and macroeconomic factors, and provide a clear, data-driven investment strategy to navigate the uncertainty ahead. Our goal is to equip you with the insights needed for informed decision-making regarding your YUNGJIN PHARM. holdings.

    The Shocking Numbers: YUNGJIN PHARM. Q3 2025 Earnings Summary

    On November 5, 2025, YUNGJIN PHARM. CO., LTD released its preliminary operating results for the third quarter. The figures, which you can verify via the Official Disclosure on DART, paint a concerning picture:

    • Revenue: 60.8 billion KRW, a 2.7% decrease from the previous quarter.
    • Operating Profit: 0 billion KRW, a staggering drop from 1.9 billion KRW in Q2 2025.
    • Net Income: -1.2 billion KRW, a complete reversal from a 0.3 billion KRW profit in the previous quarter.

    This data confirms a worrying trend of rapid deterioration throughout 2025. The absence of a market consensus for these figures means the negative reaction could be even more pronounced as the market digests this unexpected news. This performance is a far cry from the optimism seen in 2024, demanding a closer look at the company’s fundamentals.

    Why Did This Happen? A Multi-Factor Analysis

    1. Worsening Financial Health & Profitability

    The core of the problem lies in the company’s weakening financial structure. A review of YUNGJIN PHARM.’s financial performance reveals several red flags:

    • Consistent Revenue Decline: The steady drop in revenue throughout 2025 points to either intensified market competition, pricing pressure, or lagging sales of key pharmaceutical products.
    • Profitability Collapse: The plummet in operating profit to zero is the most alarming signal. It suggests that the cost of goods sold (COGS) and selling, general, & administrative (SG&A) expenses now consume all revenue, leaving nothing for profit.
    • Rising Debt: The debt-to-equity ratio has climbed steadily, reaching 114.65% in 2024. This increasing leverage makes the company more vulnerable to interest rate hikes and financial instability.
    • Negative Capital Efficiency: Persistently negative Return on Equity (ROE) and Price-to-Earnings (PER) ratios reflect poor use of capital and deeply negative market sentiment.

    2. Macroeconomic Headwinds

    External economic pressures are compounding YUNGJIN PHARM.’s internal issues. As reported by leading financial news outlets like Bloomberg, global markets face significant volatility. Key factors affecting the company include:

    • Exchange Rate Pressure: A strong US Dollar against the Korean Won increases the cost of importing raw pharmaceutical ingredients, directly squeezing profit margins.
    • Interest Rate Sensitivity: With a high debt load, any increases in benchmark interest rates translate to higher interest expenses, further eroding the bottom line.
    • Rising Commodity Prices: Elevated prices for oil and other raw materials drive up manufacturing and logistics costs, contributing to the margin compression seen in the Q3 report.

    3. Internal & Operational Concerns

    Past disclosures raise questions about the company’s internal controls and long-term strategy. The Financial Supervisory Service’s request for a correction to the 2024 business report hints at potential transparency issues. Furthermore, the stark contrast between the positive 2024 results and the 2025 decline suggests that last year’s performance may have been a temporary anomaly rather than a sustainable turnaround. For a broader view, see our analysis of the Korean pharmaceutical sector.

    Investor Action Plan & Outlook

    Given the deeply negative YUNGJIN PHARM. Q3 2025 earnings, a cautious and defensive stance is warranted. The combination of deteriorating fundamentals, external pressures, and internal uncertainties creates a high-risk environment.

    Our overall investment opinion for YUNGJIN PHARM. is BEARISH. The path to recovery appears uncertain, and significant downside risk remains until management can present and execute a credible turnaround strategy.

    Recommended Investment Strategy

    • Short-Term (0-3 Months): Expect significant stock price volatility and downward pressure. Avoid new positions and consider risk-mitigation strategies for existing holdings. A ‘wait and see’ approach is prudent.
    • Mid- to Long-Term (3+ Months): The company’s future hinges on management’s response. Watch for detailed plans addressing cost control, revenue generation, and debt reduction. The progress of key pipeline products, like the ‘Cephacafen Granules’ for China, will be a critical catalyst.

    Frequently Asked Questions (FAQ)

    What were the key takeaways from YUNGJIN PHARM.’s Q3 2025 results?

    The key takeaways are a 2.7% revenue decline, operating profit falling to zero, and a net loss of 1.2 billion KRW. This indicates a severe and rapid deterioration in profitability and operational efficiency compared to previous quarters.

    Why was the 2024 performance so different from 2025?

    While 2024 showed record sales and a return to net profit, the sharp decline in 2025 suggests the previous year’s success may have been driven by one-off events or a business environment that has since changed dramatically. A thorough explanation from management is required to clarify this discrepancy.

    What is the current investment recommendation for YUNGJIN PHARM. stock?

    Our current investment opinion is BEARISH. We advise investors to exercise extreme caution due to high stock price volatility and fundamental weaknesses. A clear, actionable turnaround plan from management is needed before revisiting this outlook.

    (003520) YUNGJIN PHARM. Q3 2025 Earnings Analysis: Zero Profit & Red Alert for Investors 관련 이미지
  • (483650) d’Alba Global Earnings Shock (483650): Deep Dive Analysis & 2025 Stock Strategy

    (483650) d’Alba Global Earnings Shock (483650): Deep Dive Analysis & 2025 Stock Strategy

    The latest d’Alba Global earnings report for Q3 2025 has sent a wave of concern through the investment community. For a company celebrated for its premium vegan beauty brand ‘d’Alba’ and its impressive growth trajectory, the preliminary figures were a significant disappointment. Investors are now grappling with critical questions: Was this a temporary setback or a sign of deeper issues? And what is the most prudent d’Alba investment strategy moving forward? This deep-dive analysis unpacks the numbers, explores the underlying causes, and provides a clear roadmap for evaluating the future of d’Alba Global stock.

    Deconstructing the d’Alba Global Earnings Shock

    The preliminary Q3 results, released on November 5, 2025, fell alarmingly short of consensus expectations, particularly on the profitability front. The official figures paint a stark picture, which you can verify in the company’s Official Disclosure. Let’s examine the key metrics:

    • Revenue: KRW 117.3 billion, missing market expectations by 5.0%.
    • Operating Profit: KRW 16.7 billion, a staggering 31.0% below expectations.
    • Net Profit: KRW 14.0 billion, an even more dramatic 44.0% miss.

    While a revenue miss is concerning, the severe underperformance in operating and net profit points to a significant erosion of the company’s profitability. This is the core issue that has rattled investor confidence and demands a closer look.

    The Alarming Plunge in Profit Margins

    To understand the severity, we must compare this quarter to past performance. In the first half of 2025, d’Alba Global was a model of profitability, boasting an operating profit margin of 24.48%. In Q3, that figure collapsed to just 14.24%. Similarly, the net profit margin fell from 18.38% to 11.94%. This isn’t just a minor fluctuation; it suggests a fundamental shift in the company’s cost structure or pricing power. The quarter-over-quarter revenue also declined by 8.6%, indicating that the growth engine is sputtering, at least temporarily.

    The Q3 results reveal a dual threat: slowing top-line growth combined with rapidly deteriorating bottom-line profitability. This combination is a significant red flag for any growth-oriented company.

    Balancing Strengths Against Market Headwinds

    Before this report, the investment thesis for 483650 stock analysis was built on solid fundamentals. It’s crucial to weigh these enduring strengths against the new macroeconomic challenges.

    Enduring Company Strengths

    • Strategic Diversification: Management has wisely expanded beyond cosmetics into health foods (‘Veganery’) and beauty devices, which could provide new, resilient revenue streams. You can read more about this trend in our analysis of the K-beauty market.
    • Global Footprint: Aggressive expansion into international markets remains a primary growth lever, reducing dependency on the domestic market.
    • Financial Stability: A low debt-to-equity ratio of 25.41% (as of H1 2025) means the company is not over-leveraged and has the financial health to weather downturns.

    Mounting Macroeconomic Pressures

    Unfortunately, d’Alba Global operates in a challenging global environment. Several external factors are likely contributing to the margin compression:

    • Currency & Commodity Costs: A rising KRW/USD exchange rate and higher oil prices (WTI $60.43) directly increase the cost of imported raw materials and manufacturing.
    • Logistics Expenses: A surge in international shipping indices means higher costs to get products to its global customers.
    • Interest Rate Environment: As reported by sources like Bloomberg, rising US 10-Year Treasury yields typically lead to investor risk aversion, which disproportionately affects growth stocks like d’Alba Global.

    The Investor’s Action Plan: A Cautious Path Forward

    Given the negative sentiment surrounding the d’Alba Global earnings, a reactive decision could be costly. A prudent and strategic approach is required. The stock price will likely face significant downward pressure in the short term. For long-term investors, the focus should be on verification and patience.

    Key Actions for Investors:

    • Analyze the Q4 Outlook: Pay close attention to management’s guidance for the upcoming quarter during their next earnings call. Are they providing a concrete plan to restore margins?
    • Scrutinize New Ventures: Demand clear data on the performance of the ‘Veganery’ and beauty device segments. Are they contributing meaningfully to revenue and, more importantly, profit?
    • Monitor Macro Indicators: Keep an eye on the macroeconomic factors mentioned above. A stabilization or reversal in these trends could provide a tailwind for the company.
    • Adopt a ‘Wait and See’ Stance: Avoid making hasty buys or sells. The prudent move is to wait for Q4 results and 2026 guidance to confirm whether the company can navigate these challenges and reignite its growth story.

    In conclusion, while d’Alba Global’s long-term potential from diversification and global expansion remains, the Q3 earnings have introduced serious profitability concerns. The path forward for investors is to demand evidence of a turnaround before committing further capital. The narrative has shifted from pure growth to one of resilience and margin recovery.

    Disclaimer: This report is based on the provided information and analysis; the final responsibility for investment decisions rests with the investor.

    (483650) d'Alba Global Earnings Shock (483650): Deep Dive Analysis & 2025 Stock Strategy 관련 이미지
  • (007340) DN AUTOMOTIVE CORPORATION Earnings (007340): Q3 2025 Analysis & Stock Investment Strategy

    (007340) DN AUTOMOTIVE CORPORATION Earnings (007340): Q3 2025 Analysis & Stock Investment Strategy

    The latest DN AUTOMOTIVE CORPORATION earnings report for Q3 2025 presents a complex picture for investors. The company (007340), a significant player with a diverse portfolio in automotive parts and machine tools, has revealed preliminary figures showing healthy revenue growth juxtaposed with a concerning dip in operating profit. This mixed signal has left the market pondering its next move.

    How should investors interpret these numbers? Is the revenue growth a sign of fundamental strength, or does the profitability decline foreshadow deeper issues? This comprehensive analysis will break down the DN AUTOMOTIVE stock outlook, examining corporate fundamentals, macroeconomic headwinds, and providing a clear investment strategy to help you make informed decisions.

    DN AUTOMOTIVE’s Q3 2025 Preliminary Earnings at a Glance

    On November 5, 2025, DN AUTOMOTIVE CORPORATION released its preliminary consolidated financial results, which can be verified in the company’s Official Disclosure. The key performance indicators paint a nuanced story:

    • Revenue: KRW 918.7 billion. This figure represents a slight but steady year-over-year increase, signaling sustained demand and market presence.
    • Operating Profit: KRW 118.7 billion. The most notable point of concern, this marks a slight decrease quarter-over-quarter, raising questions about margin compression.
    • Net Profit: KRW 66.9 billion. A modest rebound from the previous quarter, but its sustainability is yet to be confirmed.

    While top-line growth is a positive sign of the company’s operational resilience, the decline in operating profit suggests that rising costs or pricing pressures are beginning to eat into profitability.

    The core challenge for DN AUTOMOTIVE is clear: converting strong sales into stronger profits. The divergence between revenue and operating profit is the central theme of this quarter’s results.

    Analysis: The Forces Shaping Performance

    To understand the DN AUTOMOTIVE CORPORATION earnings, we must look beyond the headline numbers and analyze the interplay between internal strategies and external market forces.

    Internal Strategy and Business Structure

    DN AUTOMOTIVE’s strength lies in its diversified business, spanning automotive parts, machine tools, and its emerging battery business. The recent merger with Dong-A Tire & Rubber and the shift to a holding company structure are strategic moves designed to unlock synergies and improve efficiency. However, this diversification also exposes the company to varied segment-specific challenges.

    • Revenue Drivers: Continued investment in new factory expansions and cross-segment sales likely bolstered the top line.
    • Profitability Headwinds: The profit dip could stem from rising raw material costs, increased logistics expenses, or intensified competition in the machine tool market forcing price concessions. For a deeper understanding of how such factors are reported, investors can review guides on reading corporate financial statements.

    The Macroeconomic Gauntlet

    No company operates in a vacuum. Broader economic trends, as reported by outlets like Reuters, are exerting significant pressure:

    • Currency Volatility: A strong USD relative to the KRW increases the cost of imported raw materials and components, directly impacting profit margins.
    • High Interest Rates: Elevated benchmark rates in both Korea and the U.S. increase the cost of capital, making debt servicing more expensive, a notable risk given the company’s high debt-to-asset ratio.
    • Raw Material Costs: While a decline in oil prices provides some relief on transportation costs, the price volatility of specialized materials like rubber remains a key variable.

    Investment Strategy for DN AUTOMOTIVE Stock

    Given this complex environment, a carefully considered investment strategy for DN AUTOMOTIVE is crucial. We recommend a bifurcated approach based on investment horizon.

    Short-Term Outlook: Caution and Patience

    In the immediate term, the market is likely to focus on the negative signal of declining operating profit. This could create downward pressure on the DN AUTOMOTIVE stock price until the company provides clarity. A prudent short-term strategy is a “wait-and-see” approach. Investors should wait for the final, confirmed earnings report and pay close attention to management’s commentary on margin improvement plans.

    Mid- to Long-Term Potential: A Balancing Act

    The long-term picture is more balanced, with clear growth drivers and significant risks.

    • The Bull Case: Growth can be fueled by synergies from the Dong-A merger, the ramp-up of new production facilities, and the company’s diversified revenue streams. Proactive shareholder-friendly policies like dividends and stock buybacks also build investor confidence.
    • The Bear Case: The high debt-to-asset ratio remains a significant vulnerability, especially in a high-interest-rate environment. Continued margin erosion and macroeconomic volatility are the primary risks to monitor.

    Frequently Asked Questions (FAQ)

    What were DN AUTOMOTIVE’s key Q3 2025 results?

    The company reported preliminary revenue of KRW 918.7 billion (an increase), operating profit of KRW 118.7 billion (a decrease), and net profit of KRW 66.9 billion (a slight rebound).

    Why did operating profit fall if revenue grew?

    The decline is likely due to a combination of factors, including rising costs for raw materials and logistics, pricing pressures from competitors, or temporary underperformance in one of its key business segments. The final report will provide more specific details.

    What is the recommended investment approach for 007340 now?

    A conservative, patient approach is advised. Investors should wait for the confirmed earnings release and management’s strategic plans for improving profitability before making significant investment decisions. Continuous monitoring of the company’s debt levels and macroeconomic conditions is essential.

    Disclaimer: This analysis is based on publicly available preliminary information and is intended for informational purposes only. It does not constitute investment advice. All investment decisions are the sole responsibility of the investor.

    (007340) DN AUTOMOTIVE CORPORATION Earnings (007340): Q3 2025 Analysis & Stock Investment Strategy 관련 이미지