Tag: Q3 2025 Earnings

  • (189980) HYUNGKUK F&B Earnings Q3 2025: In-Depth Stock Analysis (KRX: 189980)

    (189980) HYUNGKUK F&B Earnings Q3 2025: In-Depth Stock Analysis (KRX: 189980)

    This comprehensive HYUNGKUK F&B earnings analysis for Q3 2025 provides a deep dive into the company’s latest financial performance (KRX: 189980). Following the recent announcement, the market has shown a mixed response. While top-line figures like revenue and operating profit showed resilience, a noticeable dip in net income has raised important questions for investors. We will dissect the key growth drivers, analyze the pressing macroeconomic headwinds, and outline a strategic outlook for potential and current shareholders, balancing the company’s ambitious diversification with its current financial vulnerabilities.

    Breaking Down the Q3 2025 Earnings Report

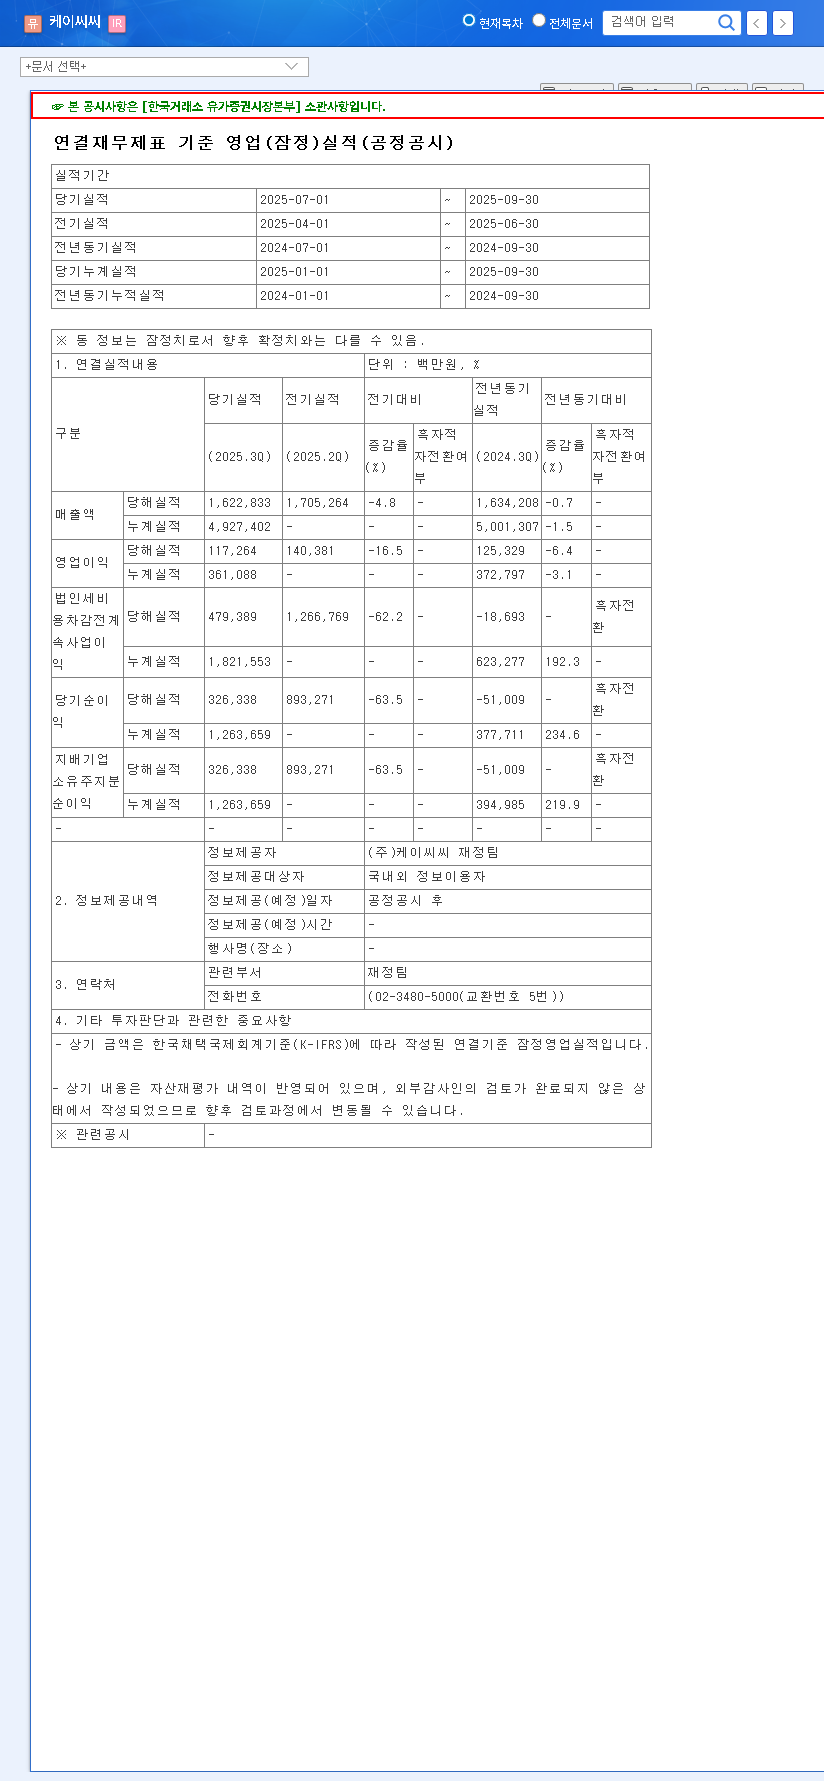
    On November 7, 2025, HYUNGKUK F&B released its provisional third-quarter results, providing a crucial snapshot of its operational health. The figures, sourced from the company’s Official Disclosure on DART, are as follows:

    • Revenue: KRW 28.6 billion
    • Operating Profit: KRW 3.0 billion
    • Net Income: KRW 1.8 billion

    While revenue and operating profit posted a modest sequential increase over Q2 2025, the decline in net income has become the central point of discussion. This divergence suggests that while the core business operations remain stable, non-operating factors such as rising costs, investment expenditures, or increased financial burdens are beginning to weigh on the bottom line. Understanding these underlying pressures is critical for any accurate HYUNGKUK F&B stock analysis.

    Fundamental Analysis: Diversification vs. Financial Strain

    Core Growth Drivers & Strategic Initiatives

    HYUNGKUK F&B is not standing still. The company is actively pursuing a strategy of business diversification to build long-term, sustainable growth. Key initiatives include expanding into alcoholic beverages, developing new prune-based health products, and strengthening its coffee division. A major technological advantage is the expansion of its High-Pressure Processing (HPP) facilities. This technology allows for the creation of premium, preservative-free beverages with a longer shelf life, a significant differentiator in the competitive F&B market. This, combined with a robust B2B distribution network, forms the foundation of its future growth potential.

    The success of HYUNGKUK F&B’s long-term vision hinges on its ability to successfully launch and scale these new ventures while navigating near-term financial and macroeconomic challenges.

    Potential Risks and Company Headwinds

    Despite the promising growth strategy, the latest HYUNGKUK F&B earnings report highlights several short-term risks. The primary concern is earnings volatility, evidenced by the declining net income. Furthermore, the company’s balance sheet shows increasing financial burdens, characterized by a high debt ratio and a significant rise in short-term borrowings. In an environment of rising interest rates, this debt structure poses a considerable risk to profitability, as financing costs are set to increase.

    The Macroeconomic Gauntlet: External Pressures

    No company operates in a vacuum. The current global macroeconomic climate presents significant challenges that could directly impact HYUNGKUK F&B’s performance.

    • Adverse Exchange Rates: With the KRW weakening against both the USD and EUR, the cost of importing essential raw materials like coffee beans, fruit concentrates, and packaging is rising sharply. This directly squeezes profit margins.
    • High Interest Rate Environment: With central banks in the US and Korea maintaining high benchmark rates, borrowing has become more expensive. This is particularly concerning for HYUNGKUK F&B given its reliance on short-term debt to finance operations and expansion.
    • Rising Commodity Prices: Volatility in international oil prices affects logistics and transportation costs, adding another layer of cost pressure on the company’s supply chain.

    Investor Action Plan & Future Outlook

    Given the complex picture painted by the Q3 results, investors should adopt a nuanced approach. A prudent strategy requires balancing short-term caution with a long-term perspective focused on the company’s strategic execution.

    Key Watch Points for Investors

    Moving forward, monitoring the following areas will be crucial for making informed decisions:

    • New Business Performance: Closely track the market reception and initial revenue from the new alcoholic beverage and prune product lines.
    • Financial Health Improvements: Look for concrete steps taken by management to improve the debt ratio and manage short-term liabilities. You can learn more about how to analyze corporate debt here.
    • Margin Management: Pay attention to gross and operating margins in the upcoming HYUNGKUK F&B earnings reports to see if the company is successfully managing rising input costs.
    • Macroeconomic Trend Impact: Keep an eye on authoritative sources like The Economist for shifts in currency and interest rate forecasts that could affect the company.

    In conclusion, while the short-term outlook for HYUNGKUK F&B (KRX: 189980) is clouded by macroeconomic pressures and internal financial constraints, its long-term growth strategy centered on diversification and technological advantage holds promise. Prudent investors will weigh these factors carefully, demanding clear evidence of successful execution and financial discipline in the quarters to come.

    (189980) HYUNGKUK F&B Earnings Q3 2025: In-Depth Stock Analysis (KRX: 189980) 관련 이미지
  • (069620) Daewoong Pharma Earnings (Q3 2025): In-Depth Analysis of Revenue Miss & Profit Surprise

    (069620) Daewoong Pharma Earnings (Q3 2025): In-Depth Analysis of Revenue Miss & Profit Surprise

    The latest Daewoong Pharma earnings report for Q3 2025 has presented a fascinating puzzle for investors and market analysts. While top-line revenue slightly missed expectations, the company delivered a significant ‘earnings surprise’ in its operating profit, signaling robust underlying profitability and operational efficiency. This in-depth analysis will dissect the provisional financial results, explore the core drivers behind this mixed performance, and provide a strategic outlook for investors evaluating Daewoong Pharma stock.

    How did Daewoong Pharma orchestrate such a strong profit performance amidst revenue headwinds? We will explore the fundamental metrics, macroeconomic influences, and future catalysts that will shape the company’s trajectory.

    Deconstructing the Q3 2025 Earnings Report

    On November 7, 2025, Daewoong Pharma released its provisional Q3 earnings, with the market immediately focusing on two key conflicting data points. The provisional figures, released in the company’s Official Disclosure, paint a complex but ultimately promising picture. Here are the headline numbers:

    • Revenue: KRW 355.1 billion, which was 5% below the market consensus of KRW 372.2 billion.
    • Operating Profit: KRW 53.5 billion, a remarkable 11% above the market estimate of KRW 48.1 billion, creating the ‘earnings surprise’.
    • Net Profit: KRW 43.1 billion, showcasing a significant recovery and improvement from weaker performance in the prior year.

    Despite a revenue shortfall, Daewoong Pharma’s ability to significantly boost operating profit by 43.4% year-over-year showcases remarkable operational efficiency and a strengthening core business.

    Fundamental Analysis: The ‘Why’ Behind the Numbers

    The Profit Powerhouse: Drivers of the Earnings Surprise

    The surge in operating profit, up 43.4% year-over-year, is the central story of this earnings report. This impressive margin expansion, despite a 1.0% YoY revenue dip, points to several positive internal developments. The most likely drivers include a strategic shift towards a higher-margin product mix, successful implementation of stringent cost-control measures, and tangible gains in manufacturing and operational productivity. This demonstrates a sophisticated management approach focused on profitability over sheer volume, a key metric in any pharmaceutical stock analysis.

    Revenue Growth and Financial Stability

    While the revenue miss raises questions about near-term growth momentum, the company’s full-year 2025 projections remain positive, with revenue expected to reach KRW 8.048 trillion (+2.2% YoY). The more critical forecast is the projected 39.6% YoY increase in full-year operating profit. The company’s financial health appears solid; as of 2024, its debt-to-equity ratio was a manageable 84.85%, and a current ratio of 109.81% indicates sufficient liquidity to cover short-term liabilities, providing a stable foundation for future growth.

    Navigating Macroeconomic Crosswinds

    No company operates in a vacuum, and Daewoong Pharma is subject to several external economic forces. Persistent volatility in the USD/KRW and EUR/KRW exchange rates can directly impact the profitability of its international sales and the performance of overseas subsidiaries. Furthermore, rising international oil prices could exert upward pressure on production and logistics costs. On the other hand, declining global shipping indices may offer some relief. Investors must monitor how effectively the company hedges against these risks to protect its impressive margins.

    A Strategic Action Plan for Investors

    Given the nuances of the Q3 2025 Daewoong Pharma earnings, a prudent investment strategy requires a forward-looking and multifaceted approach. Before making any decisions, investors should consider the following action points:

    • Analyze the Final Report: Go beyond the provisional numbers. When the detailed report is released, scrutinize the segment-by-segment performance to identify precisely which products drove the margin improvements.
    • Monitor Key Pipelines: Future revenue growth hinges on the global market penetration of key drugs like ‘Fexuclue’ (GERD) and ‘Enavlo’ (diabetes). It’s also crucial to monitor R&D progress, a topic we cover in our deep dive into Daewoong Pharma’s R&D pipeline.
    • Assess Macro Resilience: Evaluate the company’s strategies for managing external risks, such as its currency hedging policies and supply chain diversification, to ensure profitability is protected from market volatility.
    • Re-evaluate Valuation: Observe how the market digests this earnings surprise. Analyze whether the improved profitability is being fairly priced into the Daewoong Pharma stock valuation. For a broader view, consult high-authority sources like Bloomberg’s pharmaceutical sector analysis.

    In conclusion, Daewoong Pharma’s Q3 2025 results signal a company successfully optimizing its business structure for profitability. The key challenge ahead will be reigniting top-line revenue growth while defending these hard-won margins against a complex global backdrop. Meticulous analysis and ongoing vigilance are essential for any investor considering this promising but evolving opportunity.

    (069620) Daewoong Pharma Earnings (Q3 2025): In-Depth Analysis of Revenue Miss & Profit Surprise 관련 이미지
  • (104830) WONIK Materials Q3 2025 Earnings Beat: Turnaround Signal or Investor Trap?

    (104830) WONIK Materials Q3 2025 Earnings Beat: Turnaround Signal or Investor Trap?

    The latest WONIK Materials Q3 2025 earnings report has sent ripples through the investment community, delivering a surprise beat that defies a challenging macroeconomic backdrop. For investors closely watching WONIK Materials stock, the pivotal question is whether this performance marks a genuine, sustainable turnaround or simply a fleeting bright spot in a longer-term downtrend. This comprehensive analysis will dissect the results, evaluate the underlying fundamentals, and provide a clear investment outlook for 2026 and beyond.

    We’ll explore the core drivers behind the Q3 success, weigh them against persistent risks highlighted in previous reports, and offer an actionable strategy for current and prospective shareholders. Understanding the nuances of this report is key to making an informed decision.

    Dissecting the WONIK Materials Q3 2025 Earnings Report

    WONIK Materials Co.,Ltd. announced preliminary Q3 2025 results that comfortably surpassed market consensus, particularly in profitability metrics. This positive deviation has injected a dose of optimism into a stock that has faced headwinds. The full details can be reviewed in the company’s Official Disclosure.

    Key Financial Highlights vs. Expectations

    • Revenue: Reported KRW 82.8 billion against an expected KRW 81.0 billion, a +2.22% beat.
    • Operating Profit: Reported KRW 14.2 billion versus an expected KRW 13.3 billion, a significant +6.77% beat.
    • Net Income: Reported KRW 12.5 billion compared to an expected KRW 11.2 billion, an impressive +11.61% beat.

    The standout figure is the operating profit margin of 17.15%, a strong rebound that echoes the high profitability seen in Q1. This suggests improved operational efficiency or a more favorable product mix, effectively halting the recent trend of margin erosion and declining sales.

    The ‘Why’: Unpacking the Drivers and Risks

    To understand if this is a sustainable shift, we must look beyond the headline numbers and analyze the underlying company fundamentals and the broader macroeconomic environment.

    Company Fundamentals: A Mixed Picture

    While the Q3 report is encouraging, the H1 2025 semi-annual report painted a more cautious picture with several persistent challenges:

    • Structural Revenue Decline: The multi-year trend of falling revenue, largely due to reduced sales of key products like NH3, has not yet been definitively broken, even with the Q3 beat.
    • High SG&A Expenses: Selling, General, and Administrative (SG&A) costs remain stubbornly high, consuming a significant portion of revenue and putting pressure on operating margins.
    • Financial Health Watch: An increasing debt-to-equity ratio (26.69%) driven by new borrowings is a point of concern, especially in a high-interest-rate environment which could inflate debt servicing costs.

    On the positive side, WONIK Materials continues its commitment to future growth through sustained R&D investment and planned expansions of its production infrastructure. These are crucial long-term catalysts.

    Macroeconomic Tailwinds and Headwinds

    The broader market offers both opportunities and threats. The global semiconductor and display markets are poised for growth in 2025, fueled by massive investments in AI, 5G, and automotive technologies. Leading industry analysts at Gartner project a robust recovery, which is a significant tailwind for materials suppliers like WONIK. However, unfavorable currency fluctuations (a weak Won vs. USD/EUR) and persistent high interest rates could increase import costs and financial burdens, potentially offsetting some of the market-driven gains.

    Investment Outlook: Bull vs. Bear Case

    While the Q3 earnings surprise provides short-term momentum, a prudent investment strategy must weigh the potential for a full recovery against the underlying financial and market risks.

    The Bull Case (The Turnaround is Real)

    Investors with a bullish outlook will point to the strong Q3 performance as the first concrete evidence that the company’s strategic initiatives are bearing fruit. The argument is that improved operational efficiency, coupled with a recovering semiconductor market, will create a powerful upward trajectory. If R&D investments lead to new, high-margin products, and planned infrastructure expansion captures new market share, the current stock price could represent a significant value opportunity.

    The Bear Case (A Temporary Reprieve)

    Conversely, a bearish perspective would frame the Q3 beat as an anomaly. Skeptics will argue that the fundamental issues of declining core revenue, a high SG&A cost structure, and rising debt have not been solved. They will wait for multiple quarters of sustained growth before confirming a turnaround. The risk is that macroeconomic pressures could intensify, and the company may struggle to translate its R&D spending into profitable revenue streams, making this a potential value trap.

    Investor Action Plan & Final Verdict

    Given the data, a strategy of cautious optimism is warranted. The WONIK Materials Q3 2025 earnings are undeniably positive and should provide short-term support for the stock price. However, long-term investors should not disregard the underlying risks.

    • Monitor Key Metrics: Watch for consistent quarter-over-quarter revenue growth and improvements in operating margin in the upcoming Q4 and 2026 reports.
    • Track Growth Drivers: Look for specific announcements regarding new customer acquisitions or successful commercialization of R&D projects.
    • Contextualize Performance: Compare WONIK’s results against competitors and the broader market by reviewing our complete analysis of the global semiconductor supply chain.

    In conclusion, while this earnings report is a significant step in the right direction, it is just one data point. A smart investment in WONIK Materials requires patience and continued diligence to confirm that this positive signal is the start of a new long-term trend.

    (104830) WONIK Materials Q3 2025 Earnings Beat: Turnaround Signal or Investor Trap? 관련 이미지
  • (002790) AMOREPACIFIC Q3 2025 Earnings Analysis: Overseas Boom Masks Profit Woes for Investors

    (002790) AMOREPACIFIC Q3 2025 Earnings Analysis: Overseas Boom Masks Profit Woes for Investors

    The latest AMOREPACIFIC Q3 2025 earnings report, released November 6, 2025, presents a fascinating paradox for investors. On one hand, the K-beauty giant showcased impressive, robust growth in its overseas markets, a clear sign of successful global expansion. On the other, a significant and unexpected decline in net income has cast a shadow over the otherwise positive results, raising critical questions about profitability and underlying pressures. This deep-dive analysis will dissect the numbers, explore the drivers behind this dual narrative, and provide a strategic outlook for those monitoring AMOREPACIFIC stock.

    While top-line growth is encouraging, the sharp contraction in net income signals underlying challenges that investors must carefully evaluate. This quarter is a tale of international success story meeting domestic and macroeconomic headwinds.

    Q3 2025 Performance by the Numbers

    AMOREPACIFIC Holdings Corp. reported a mixed but revealing financial scorecard for the third quarter. While revenue and operating profit showed year-on-year improvements, the bottom line tells a different story. For a complete breakdown, investors can review the Official Disclosure (Source) filed with the DART system.

    Here’s a snapshot of the key consolidated figures:

    • Revenue: KRW 1,108.2 billion. This marks a healthy increase from Q3 2024 (KRW 1,068.1 billion) and Q2 2025 (KRW 1,009.5 billion), demonstrating sustained top-line growth.
    • Operating Profit: KRW 104.3 billion. A significant jump from Q3 2024 (KRW 75.0 billion), indicating that the company’s core operations are becoming more efficient and profitable.
    • Net Income: KRW 37.3 billion. This is the primary point of concern, representing a sharp decline from Q3 2024 (KRW 51.6 billion) and an even steeper drop from Q2 2025 (KRW 50.8 billion).

    The Engine of Growth: Unpacking Overseas Success

    The standout positive from the AMOREPACIFIC Q3 2025 earnings is the powerful performance of its international business. This success isn’t accidental but the result of a deliberate multi-pronged strategy.

    Americas and EMEA Expansion

    Growth in the Americas and EMEA (Europe, Middle East, Africa) regions continues to be a major revenue driver. Brands like Laneige and Sulwhasoo have successfully penetrated these markets, resonating with a new customer base seeking high-quality, innovative skincare. This geographical diversification is crucial for de-risking the company’s reliance on any single market.

    The COSRX Acquisition Impact

    The strategic acquisition of COSRX continues to pay dividends. As a digitally-native brand with a cult following, COSRX provides AMOREPACIFIC with a stronger foothold in online channels and among younger demographics globally. Its performance is a significant contributor to the consolidated revenue figures and strengthens the company’s overall brand portfolio.

    The Headwinds: Why Did Net Income Falter?

    The steep drop in net income can be attributed to a convergence of external pressures and market-specific challenges that are squeezing profit margins, reflecting broader global economic trends discussed by outlets like Bloomberg.

    • China Market Instability: The Chinese market, once a primary growth engine, remains a significant source of uncertainty. Intensifying competition from local ‘C-beauty’ brands and a shifting regulatory landscape are making it harder to maintain market share and profitability. The sluggish performance here likely weighed heavily on the Q3 bottom line.
    • Macroeconomic Pressures: Unfavorable currency exchange rates, volatile raw material prices, and elevated logistics costs are creating a high-pressure cost environment. These factors directly impact the cost of goods sold and can erode profitability even when revenue is growing.
    • Rising Financial Costs: Global interest rate hikes increase the cost of borrowing, leading to higher interest expenses. This financial burden can directly reduce net income, impacting the final profit available to shareholders.

    Strategic Investor Outlook & Key Monitorables

    For investors, the key is to determine whether the Q3 net income decline is a temporary blip or the start of a trend. While the positive fundamentals of overseas growth are strong, vigilance is required. This is a topic we explored in our deep dive on the future of the K-beauty market. Moving forward, focus should be on the following areas:

    • China Turnaround Strategy: Monitor the effectiveness of AMOREPACIFIC’s efforts to restructure and regain a competitive edge in the complex Chinese market.
    • Margin Protection Measures: Watch for corporate initiatives aimed at cost control, supply chain optimization, and efficient resource allocation to protect profitability.
    • Sustained International Momentum: Verify that the impressive growth in the Americas and EMEA can be sustained and expanded upon in coming quarters.
    • Innovation Pipeline: Assess the company’s investment in R&D and its ability to launch innovative products that capture consumer interest and drive future growth.

    (002790) AMOREPACIFIC Q3 2025 Earnings Analysis: Overseas Boom Masks Profit Woes for Investors 관련 이미지
  • (241710) COSMECCA KOREA Q3 2025 Earnings Analysis: Deep Dive & Stock Outlook

    (241710) COSMECCA KOREA Q3 2025 Earnings Analysis: Deep Dive & Stock Outlook

    The latest COSMECCA KOREA Q3 2025 earnings report has sent ripples through the investment community, showcasing results that didn’t just meet but dramatically exceeded market expectations. As a powerhouse in the cosmetics Original Design Manufacturer (ODM) and Original Equipment Manufacturer (OEM) sector, the company’s performance offers a crucial barometer for the health of the K-beauty industry and provides a compelling case study for savvy investors. This deep-dive analysis unpacks the preliminary numbers, explores the fundamental drivers behind this explosive growth, and outlines a strategic outlook for what comes next.

    With operating profits soaring 36% above estimates, COSMECCA KOREA has demonstrated exceptional operational leverage and market adaptability, signaling a new phase of robust profitability.

    Deconstructing the Q3 2025 Earnings Beat

    On November 6, 2024, COSMECCA KOREA released its preliminary Q3 results, which can be viewed in the Official Disclosure (DART Report). The figures paint a clear picture of a company firing on all cylinders. The sheer scale of the outperformance against consensus estimates is the key story here, highlighting a significant disconnect between market perception and operational reality.

    The Numbers at a Glance:

    • Revenue: Reached KRW 182.4 billion, a staggering 22.0% above the KRW 149.7 billion estimate. This points to surging demand and successful client acquisition.
    • Operating Profit: Hit KRW 27.2 billion, trouncing the KRW 20.0 billion forecast by 36.0%. This significant margin beat indicates powerful improvements in production efficiency and cost control.
    • Net Profit: Came in at KRW 16.7 billion, slightly ahead of the KRW 16.1 billion estimate by 3.7%, solidifying the bottom-line strength.

    This performance confirms that the recovery momentum first seen in Q1 2025 has not only been sustained but has accelerated dramatically. The successful turnaround from the challenges of late 2022 is now complete, replaced by a new era of growth.

    Core Strengths & Strategic Wins Fueling Growth

    This blowout quarter wasn’t a fluke. It’s the result of a multi-pronged strategy focused on innovation, market alignment, and global expansion. A detailed COSMECCA KOREA stock analysis reveals several key pillars supporting this success.

    1. Riding the Wave of Modern Cosmetic Trends

    COSMECCA KOREA has expertly positioned itself to capitalize on the biggest trends in the beauty industry. Their ‘OGM (Original Global Standard)’ service model is a comprehensive solution for brands, especially the rapidly growing segment of indie brands. By investing nearly 5% of revenue into R&D, they are leading in high-demand areas like:

    • Clean Beauty: Formulations that prioritize safe, non-toxic, and sustainable ingredients.
    • Cosmeceuticals: Products that bridge the gap between cosmetics and pharmaceuticals, offering tangible skin benefits backed by science.

    2. Strategic Global Expansion via Englewood Lab

    The acquisition of US-based Englewood Lab is a cornerstone of COSMECCA’s long-term strategy. This move provides a critical production base in North America, one of the world’s largest beauty markets. It allows the company to better serve its global clients, reduce logistical complexities, and tap directly into US market trends. While this move increased short-term debt, its strategic value as a long-term growth engine cannot be overstated.

    Investor Outlook: Balancing Opportunity and Risk

    While the COSMECCA KOREA Q3 2025 earnings are overwhelmingly positive, a prudent investor must consider the full picture. The macroeconomic environment presents both tailwinds and headwinds. For a more detailed look at market dynamics, you can explore insights on the global cosmetics market growth from authoritative sources like Forbes.

    Potential Headwinds to Monitor:

    The primary risk factors revolve around financial management in a volatile global economy:

    • Interest Rate Pressure: Elevated interest rates globally increase the cost of servicing debt, which rose to a debt ratio of 99.05% following the Englewood Lab acquisition.
    • Currency Fluctuations: As a global exporter and importer of raw materials, volatility in KRW/USD and KRW/EUR exchange rates can impact margins.
    • One-Off Costs: Integration costs related to acquisitions could present short-term, non-recurring expenses that affect quarterly profit statements.

    Conclusion: A Compelling “BUY” for the Long Term

    The outstanding Q3 2025 results serve as powerful validation of COSMECCA KOREA’s strategy. The company has proven its ability to innovate, adapt, and execute at a high level. The impressive cosmetics ODM growth trajectory, combined with its expanding global footprint, establishes a strong foundation for sustained future success.

    While investors should remain vigilant about the financial and macroeconomic risks, the mid-to-long-term growth potential is undeniable. The company is perfectly positioned at the intersection of K-beauty’s global appeal and the rise of agile indie brands. Therefore, from a long-term investment perspective, the outlook remains a confident “BUY”. For more investment ideas in this space, check out our guide on Top K-Beauty Stocks to Watch.

    (241710) COSMECCA KOREA Q3 2025 Earnings Analysis: Deep Dive & Stock Outlook 관련 이미지
  • (375500) DL E&C Q3 2025 Earnings Surprise: Deep Dive Analysis & Stock Outlook (375500)

    (375500) DL E&C Q3 2025 Earnings Surprise: Deep Dive Analysis & Stock Outlook (375500)

    The latest DL E&C Q3 2025 earnings report has sent a strong signal to the market, showcasing a remarkable performance that significantly outpaced analyst expectations. In a construction sector fraught with uncertainty, DL E&C CO.,LTD. (ticker: 375500) delivered preliminary results that suggest robust operational health and strategic resilience. This in-depth analysis will dissect the key figures, explore the fundamental drivers behind this success, evaluate the macroeconomic environment, and provide a comprehensive investment outlook for the DL E&C stock.

    DL E&C Q3 2025 Earnings: A Decisive Beat

    On November 6, 2025, DL E&C released its preliminary Q3 earnings, which immediately captured investor attention. The numbers were not just good; they were a significant ‘earnings surprise’. The official disclosure, available via the DART system, confirms these impressive figures. You can view the full report here: Official Disclosure.

    Let’s break down the key performance indicators:

    • Revenue: KRW 1.907 trillion, which is a solid 4% above market consensus.
    • Operating Profit: KRW 116.8 billion, coming in 6% higher than anticipated.
    • Net Income: KRW 126.3 billion, an astonishing 29% surge above market expectations, highlighting exceptional profitability.

    The 29% beat on net income is the standout figure, suggesting that DL E&C is not only growing its top line but is also managing its bottom line with remarkable efficiency. This points to strong financial health and bodes well for future shareholder value.

    Core Drivers: Why Did DL E&C Outperform?

    This success wasn’t accidental. It stems from a combination of strong internal management and navigating external factors adeptly. Our DL E&C investment analysis identifies two primary categories of drivers.

    1. Robust Corporate Fundamentals

    The company’s core operations are firing on all cylinders. While Q3 revenue saw a slight dip from the previous quarter, the improvement in operating profit indicates that one-off costs from Q2 have been resolved, revealing the company’s true competitive strength.

    • Substantial Order Backlog: Stable execution of a large and diverse project pipeline in both housing and industrial plants provided a consistent revenue stream.
    • Effective Cost Management: Proactive measures to control raw material and logistics costs have protected profit margins, a critical achievement in an inflationary environment.
    • Seasonal Strength: The company capitalized on the construction industry’s seasonal peak period, maximizing operational output and project progression.

    2. Navigating the Macroeconomic Landscape

    The broader construction industry outlook remains complex, influenced by global economic trends. For more on this, see this analysis of global construction trends from authoritative sources. However, signs are emerging that headwinds may be easing. The potential peak of the interest rate hike cycle, with US and Korean 10-year Treasury yields stabilizing, could reduce financing costs and stimulate new projects. While currency fluctuations and volatile commodity prices remain a risk, DL E&C’s balanced portfolio provides a crucial buffer against sector-wide shocks.

    Investment Outlook: What’s Next for the DL E&C Stock?

    The strong 375500 earnings report is expected to act as a powerful catalyst for its stock price. After a period of volatility driven by macroeconomic pressures, this performance provides tangible proof of the company’s value and resilience. It is likely to reverse negative sentiment and restore investor confidence.

    However, prudent investors should remain vigilant. The construction industry is inherently cyclical. For a deeper understanding, you might want to read our Guide to Investing in the South Korean Construction Sector.

    Key Observation Points Moving Forward:

    • Future Order Intake: Monitor the company’s ability to secure new high-margin projects to sustain its backlog.
    • Interest Rate & Real Estate Trends: Keep an eye on central bank policies and the health of the domestic and international real estate markets.
    • Government Policies: Changes in infrastructure spending or housing regulations could significantly impact the entire industry.

    Conclusion: A Positive Outlook with Prudent Optimism

    In summary, the DL E&C Q3 2025 earnings report is a highly positive development. It underscores the company’s robust operational capabilities and sound financial management. This performance should provide strong upward momentum for the stock and improve overall market sentiment. The investment recommendation is ‘Positive’, but investors should continue to monitor the key macroeconomic and industry-specific variables outlined above to make well-informed decisions.

    (375500) DL E&C Q3 2025 Earnings Surprise: Deep Dive Analysis & Stock Outlook (375500) 관련 이미지
  • (011930) SHINSUNG E&G (011930) Q3 2025 Earnings Analysis: Profit Shock & Why Investors Should Be Cautious

    (011930) SHINSUNG E&G (011930) Q3 2025 Earnings Analysis: Profit Shock & Why Investors Should Be Cautious

    This comprehensive SHINSUNG E&G earnings analysis for Q3 2025 unpacks the recent preliminary earnings announcement that sent a shockwave through the investor community. While top-line revenue numbers appeared healthy, a drastic turn to an operating loss has raised serious questions about the company’s fundamental health and future prospects. For investors holding or considering SHINSUNG E&G stock (011930), understanding the underlying issues is more critical than ever. We will explore the performance breakdown, identify core business challenges, analyze external risks, and provide a clear investment thesis.

    SHINSUNG E&G’s Q3 2025 Performance: A Deceptive Headline

    The preliminary Q3 2025 results for SHINSUNG E&G, announced on November 6, 2025, painted a confusing picture. At first glance, the revenue figure seemed promising, but the profitability metrics told a different, more troubling story. The full details can be found in the company’s Official Disclosure on DART.

    • Revenue: KRW 158.6 billion, surpassing the forecast of KRW 140.9 billion.
    • Operating Profit: KRW 0.2 billion, a significant miss on the KRW 4.6 billion forecast, representing a turn to an operating loss.
    • Net Income: A loss of KRW 3.3 billion.

    This stark contrast between revenue and profit is a classic red flag. It indicates that while the company is generating sales, it is failing to convert that activity into sustainable profit, signaling deep-seated operational or structural issues.

    Unpacking the Fundamental Crisis

    A detailed review of the company’s semi-annual report reveals that the Q3 earnings shock is not an isolated incident but rather a symptom of a deepening fundamental crisis. Several key areas are cause for significant concern.

    1. Revenue Decline and Profitability Collapse

    Consolidated revenue had already decreased by 8.28% year-over-year to KRW 256.27 billion. This was driven by weakness in both the Clean Environment business (tied to volatile semiconductor and display markets) and the Renewable Energy business (plagued by a global solar module oversupply). More alarmingly, consolidated operating profit swung to a loss of KRW 1.88 billion, thanks to rising SG&A expenses and R&D costs on top of falling sales.

    2. Precarious Financial Health

    The company’s balance sheet is flashing warning signs. The debt-to-equity ratio remains at a high 147.39%, indicating significant leverage. Furthermore, liquidity is a major concern, as highlighted by deteriorating operational cash flow, which fell to a negative KRW 26.31 billion. For more information on evaluating company financials, investors can learn about analyzing key financial ratios.

    With a current ratio of just 0.77x and a quick ratio of a mere 0.05x, the company’s ability to meet its short-term obligations without selling inventory is severely constrained. This raises serious concerns about its short-term financial stability.

    Segment-Specific Headwinds and Risks

    A closer look at the core business units in this SHINSUNG E&G earnings analysis reveals specific challenges that are unlikely to resolve in the short term.

    • Clean Environment Division: While there are long-term opportunities in AI and data centers, the division’s reliance on cyclical display industry investments limits near-term growth potential.
    • Renewable Energy Division: This segment is struggling to secure profitability due to intense global competition, an oversupply in the solar market, and a sluggish domestic recovery. New investments are needed but will be difficult given the weak financial position.
    • Exchange Rate Volatility: With a high volume of foreign currency transactions, the company is highly exposed to currency fluctuations. A 10% appreciation in the USD is estimated to cause a loss of ~KRW 2.2 billion, a significant risk in the current environment.

    Investment Outlook: A Strong ‘Conservative’ Stance is Advised

    Considering the significant Q3 operating profit miss, deteriorating fundamentals, and challenging macroeconomic conditions discussed by sources like Bloomberg, the investment outlook for SHINSUNG E&G stock is decidedly negative. A short-term price rebound appears highly unlikely.

    We strongly recommend investors ‘maintain a conservative view’. A cautious approach is necessary until management presents a clear, actionable strategy to improve profitability and strengthen the balance sheet—and shows tangible results from its implementation.

    Key Risk Factors to Monitor:

    • Persistent Weakness: Continued underperformance in the Clean Environment and Renewable Energy divisions.
    • Financial Deterioration: Worsening liquidity and an increasing debt burden could trigger a financial crisis.
    • Macroeconomic Headwinds: Prolonged high interest rates and a global recession could further dampen demand and increase costs.

    Investors should meticulously track future earnings reports, strategic announcements, and changes in the macroeconomic landscape before making any decisions regarding SHINSUNG E&G stock (011930).

    (011930) SHINSUNG E&G (011930) Q3 2025 Earnings Analysis: Profit Shock & Why Investors Should Be Cautious 관련 이미지
  • (004000) LOTTE Fine Chemical Q3 2025 Earnings: A Deep Dive into Stock Performance & Future Growth

    (004000) LOTTE Fine Chemical Q3 2025 Earnings: A Deep Dive into Stock Performance & Future Growth

    The latest LOTTE Fine Chemical Q3 2025 earnings report has sent a clear signal to the market: resilience and strategic growth are paying off. In a financial quarter marked by global economic headwinds, the company delivered a performance that not only beat market consensus but also provided a robust outlook for its future. This comprehensive analysis will delve into the key figures, the drivers behind this success, the potential challenges ahead, and what this means for the LOTTE Fine Chemical stock trajectory.

    Unpacking the Stellar Q3 2025 Performance

    On November 6, 2025, LOTTE Fine Chemical unveiled its preliminary third-quarter earnings, showcasing significant outperformance against analyst predictions. These results, detailed in their Official Disclosure, highlight the company’s adept management and the strength of its diversified portfolio.

    Key Financial Highlights vs. Market Estimates

    • Revenue: Achieved KRW 443.4 billion, slightly edging out the market estimate of KRW 441.5 billion.
    • Operating Profit: Reported a strong KRW 27.6 billion, a significant 12% above the consensus estimate of KRW 24.7 billion.
    • Net Income: Reached KRW 35.2 billion, an impressive 15% higher than the market’s forecast of KRW 30.5 billion.

    This robust profitability demonstrates that despite some sectoral challenges, the company’s core strategies are effectively enhancing value and managing costs.

    Core Growth Engines: What Fueled the Success?

    The impressive Lotte earnings report wasn’t a matter of luck. It was the result of strategic focus in high-margin sectors and prudent financial management. The performance was largely anchored by the company’s innovative green materials division.

    The Power of the Green Materials Business

    The standout performer was the green materials business, particularly the industrial and pharmaceutical/food-grade product lines like MECELLOSE and HECELOSE. These cellulose ethers are crucial components in everything from construction materials and paints to pharmaceuticals and food products, offering stable, high-value revenue streams. The company’s focused efforts to expand its global market share for these specialty products have clearly been effective, offsetting weakness elsewhere.

    Strategic Expansion and Financial Fortitude

    Beyond current operations, LOTTE Fine Chemical is actively securing its future. The acceleration of new business ventures into shipping and eco-friendly energy, including ammonia and hydrogen, has bolstered investor confidence in its long-term growth narrative. This is supported by a solid financial foundation, characterized by an increase in total assets, a stable debt-to-equity ratio, and a significant rise in cash reserves, which provides ample capacity for future investments. You can explore more about industry trends in our deep dive into the sustainable chemicals market.

    Navigating Headwinds and Market Challenges

    While the overall picture is positive, the company is not without its challenges. The chemical business segment faced headwinds from declining Epichlorohydrin (ECH) prices and slower demand for caustic soda. Furthermore, the persistent global economic uncertainty, which leading economists at the World Bank have flagged, poses ongoing risks. Geopolitical tensions and raw material price volatility require continuous and careful monitoring.

    Given the strong fundamental performance and future growth prospects, we maintain a ‘Buy’ recommendation. However, we advise investors to consider future earnings trends and market conditions when evaluating target prices.

    Investor Outlook and Key Factors to Watch

    The strong LOTTE Fine Chemical Q3 2025 earnings are expected to create positive short-term momentum for the stock and significantly improve investor sentiment. Looking forward, investors should keep a close eye on the following key areas:

    • Chemical Business Recovery: Monitor for signs of a turnaround in ECH and caustic soda markets in Q4 and into the next fiscal year.
    • Green Materials Momentum: Watch for continued growth, new product applications, and further global market share expansion.
    • New Venture Progress: Look for concrete investment plans and commercialization milestones for the new ammonia and hydrogen businesses.
    • Macroeconomic Factors: Stay informed on raw material prices and exchange rate fluctuations, which can directly impact profitability.

    In conclusion, LOTTE Fine Chemical has demonstrated remarkable strength and strategic foresight. The company’s ability to leverage its high-value green materials business to offset cyclical downturns in its chemical segment, while simultaneously investing in future growth engines, positions it favorably for sustained success.

    (004000) LOTTE Fine Chemical Q3 2025 Earnings: A Deep Dive into Stock Performance & Future Growth 관련 이미지
  • (035760) CJ ENM Earnings (035760) Q3 2025: Analysis of Operating Profit Miss & Future Stock Outlook

    (035760) CJ ENM Earnings (035760) Q3 2025: Analysis of Operating Profit Miss & Future Stock Outlook

    The latest CJ ENM earnings announcement for Q3 2025 presented a complex picture for investors. On one hand, a dazzling net profit figure far surpassed expectations, creating a wave of initial optimism. However, lurking beneath this headline number was a concerning miss in operating profit, raising critical questions about the health of the company’s core businesses. This deep-dive analysis unpacks the preliminary 035760 earnings report, dissecting the conflicting signals to provide a clear outlook on what’s next for the South Korean entertainment giant.

    We will explore the fundamental drivers behind these results, from segment-specific performance to macroeconomic headwinds, to provide a comprehensive CJ ENM stock analysis. Let’s uncover the true narrative behind the numbers and what it means for your investment strategy.

    CJ ENM Q3 2025 Earnings: The Headline Figures

    CJ ENM CO., Ltd. (035760) released its Q3 2025 preliminary consolidated financial statements, revealing a stark contrast between its operational performance and bottom line. The market’s reaction has been mixed, reflecting the dual nature of the report. The complete data can be reviewed in the company’s Official Disclosure on DART.

    • Revenue: KRW 1,245.6 billion. This figure was perfectly in line with market consensus, showing a 0% variance from estimates.
    • Operating Profit: KRW 17.6 billion. A significant disappointment, falling short of expectations by a staggering 34% and signaling trouble in core operations.
    • Net Profit: KRW 45.8 billion. The highlight of the report, delivering a massive earnings surprise by exceeding estimates by over 690%.

    The core issue for investors is clear: Is the net profit surprise a sustainable sign of recovery, or a one-time event masking a deteriorating CJ ENM operating profit margin?

  • Why Did It Happen? A Deeper Analysis

    To understand the future, we must dissect the past. The divergence in profit metrics stems from different parts of the business pulling in opposite directions. The poor CJ ENM operating profit performance points to persistent challenges within its primary business segments.

    The Pressure on Core Operations

    The operating profit miss appears to be a continuation of trends seen earlier in the year. The primary culprits are the Media Platform and Film & Drama divisions. The Media Platform continues to grapple with a sluggish global advertising market, a trend affecting media companies worldwide (Source: Bloomberg). Even with growth from its streaming service, TVING, the decline in high-margin ad revenue has proven difficult to offset. Concurrently, the Film & Drama segment, despite producing global hits, is contending with soaring production costs and marketing expenses, which compress profit margins even on successful projects.

    The Truth Behind the Net Profit Surprise

    The exceptional net profit figure is highly likely attributable to non-operating, one-off events. This could include gains from the sale of assets, foreign exchange gains, or other forms of financial income that are not related to the company’s day-to-day business. While beneficial for the quarterly bottom line, these gains do not reflect a fundamental improvement in profitability or operational efficiency. Therefore, investors should view this ‘surprise’ with caution, as it is not indicative of a sustainable trend.

    What’s Next? Financial Health & CJ ENM Stock Outlook

    Looking ahead, the focus must shift to the company’s financial stability and its strategy for a turnaround. The current financial indicators from the CJ ENM Q3 2025 report suggest several areas of concern. The company’s debt-to-equity ratio remains elevated at over 138%, imposing a significant financial burden through interest payments. Furthermore, key profitability metrics like Return on Equity (ROE) have been weak, signaling that the company is struggling to generate adequate returns for its shareholders.

    For a more detailed perspective on how CJ ENM fits into the market, you can read our broader analysis of the Korean media industry landscape. The path forward for CJ ENM requires a clear and decisive strategy to address these foundational issues.

    Investor Action Plan & Recommendations

    Sustainable growth will hinge on successful execution in several key areas:

    • Profitability Over Growth: A strategic pivot from pure revenue growth to establishing a stable profit structure in the Film & Drama segment is crucial. This means tighter budget controls and a more selective content investment strategy.
    • Media Platform Reinvention: The company must accelerate its efforts to monetize its digital platforms beyond advertising, perhaps through innovative subscription tiers or strategic partnerships for TVING.
    • Financial Discipline: Addressing the high debt-to-equity ratio through improved capital efficiency and potential debt restructuring should be a top priority to improve financial health.

    Overall Opinion: The Q3 2025 CJ ENM earnings report warrants a conservative approach. While a short-term stock price bounce on the net profit news is possible, the underlying weakness in operating profit cannot be ignored. Until the company demonstrates a tangible turnaround in its core business profitability and financial health, the stock’s long-term upward momentum will likely remain constrained.

(035760) CJ ENM Earnings (035760) Q3 2025: Analysis of Operating Profit Miss & Future Stock Outlook 관련 이미지
  • (002380) KCC Corporation Earnings Q3 2025: In-Depth Stock Analysis & Future Outlook

    (002380) KCC Corporation Earnings Q3 2025: In-Depth Stock Analysis & Future Outlook

    The latest KCC Corporation earnings report for the third quarter of 2025 has captured the market’s attention, revealing a mixed but intriguing financial picture. While top-line figures like sales and operating profit came in slightly below consensus, a surprising surge in net profit suggests a more complex story beneath the surface. This in-depth analysis will dissect the official results, explore the core fundamentals driving the company, and provide a comprehensive KCC stock analysis for investors considering its long-term potential.

    We will examine the pivotal role of the KCC silicon business, weigh the opportunities against the risks, and offer a strategic outlook on what investors can expect next.

    Dissecting the KCC Corporation Q3 2025 Earnings Report

    For Q3 2025, KCC Corporation announced preliminary consolidated sales of KRW 1,622.8 billion and an operating profit of KRW 117.3 billion. These figures represented a 5% and 7% miss, respectively, compared to market expectations, which could understandably create short-term caution among investors. The full details of these results are available in the company’s regulatory filing (Source: Official Disclosure).

    However, the highlight of the announcement was the net profit, which reached KRW 326.3 billion, a notable 3% increase over market estimates. This outperformance in net profit suggests effective cost management, favorable non-operating gains, or other efficiencies that are crucial for understanding the company’s true financial health beyond the headline numbers.

    Despite a slight dip in revenue, KCC’s robust net profit and strengthening fundamentals suggest its long-term growth narrative, primarily driven by the high-demand silicon sector, remains firmly intact.

    Fundamental Health Check: Growth Drivers vs. Headwinds

    Positive Catalysts: The Engines of Future Growth

    • Dominant Silicon Segment: The KCC silicon business is the company’s crown jewel, contributing nearly half of total revenue. Its growth is directly tied to secular trends like the electric vehicle (EV) revolution, where silicones are essential for battery packs, and the rising demand for advanced medical devices in an aging global population. This strategic positioning provides a powerful, long-term tailwind.
    • Rock-Solid Core Businesses: The building materials and paints segments act as a stabilizing force. With a leading market share and trusted brand power, these divisions provide consistent cash flow, balancing the portfolio and mitigating cyclicality in other areas. This stability is a key part of any positive KCC stock analysis.
    • Fortified Financials: KCC has actively improved its balance sheet. The consolidated debt-to-equity ratio has been reduced to a manageable 120.53%, and its cash reserves have swelled to KRW 781.6 billion. This financial fortification provides a crucial buffer against macroeconomic shocks and enables strategic investments. For more on evaluating company financials, see our guide on how to analyze a balance sheet.

    Negative Factors & Potential Risks

    • Raw Material Price Volatility: The profitability of the silicon business is sensitive to fluctuations in the prices of key inputs like metal silicon and methanol. Supply chain disruptions or sudden demand spikes could compress margins.
    • Macroeconomic Headwinds: No company is immune to the broader economic environment. As noted by leading financial publications like Bloomberg, factors like global interest rate hikes, currency volatility, and geopolitical tensions can impact everything from overseas sales to raw material procurement costs.
    • Short-Term Investor Sentiment: The miss on revenue and operating profit could weigh on the stock price in the immediate term. It will be crucial to monitor trading activity, especially from foreign investors whose ownership has declined in recent years.

    Investment Thesis & Strategic Outlook

    Despite the short-term noise from the KCC Corporation earnings miss, the long-term investment thesis remains compelling. The structural growth story of its silicon business is powerful, its financial health is solid, and its core segments provide a stable foundation. While near-term volatility is expected, the company’s long-term value creation potential is significant.

    For prospective investors, a phased investment strategy is recommended. Instead of reacting to daily price swings, consider accumulating a position over time, especially during periods of market weakness. Watch for key catalysts, such as updates on the expansion of the high-value-added silicon product portfolio and the company’s guidance for the upcoming quarters, before making significant capital commitments.

    Frequently Asked Questions

    What were KCC Corporation’s headline Q3 2025 results?

    KCC reported sales of KRW 1,622.8 billion and an operating profit of KRW 117.3 billion, both below market estimates. However, net profit was a bright spot at KRW 326.3 billion, exceeding expectations by 3%.

    What is KCC Corporation’s main growth engine?

    The company’s primary growth driver is its silicon segment, which benefits from the expansion of the EV market and increased demand for medical-grade silicones. This segment accounts for nearly half of the company’s revenue.

    How is KCC Corporation’s financial stability?

    KCC’s financial health has improved significantly, with a consolidated debt-to-equity ratio of 120.53% and cash reserves of KRW 781.6 billion, enhancing its ability to navigate economic uncertainty.

    What is the long-term investment outlook for KCC stock?

    The long-term outlook is positive. Despite potential short-term stock price volatility, KCC’s strong position in the growing silicon market, stable core businesses, and solid financial footing support a valid long-term growth narrative.

    (002380) KCC Corporation Earnings Q3 2025: In-Depth Stock Analysis & Future Outlook 관련 이미지