Tag: Preliminary Earnings

  • (109080) OPTICIS Q3 2025 Earnings Analysis: Deep Dive into the Numbers & Future Outlook

    (109080) OPTICIS Q3 2025 Earnings Analysis: Deep Dive into the Numbers & Future Outlook

    The latest OPTICIS Q3 2025 earnings report has sparked considerable discussion among investors. The preliminary figures indicate a sequential slowdown, raising questions about the company’s robust growth trajectory. Is this a temporary hiccup, a sign of ‘growth pains’ in a volatile market, or the beginning of a more significant trend? This in-depth OPTICIS stock analysis will dissect the preliminary earnings, evaluate the company’s core fundamentals, and provide a strategic outlook for investors.

    Dissecting the OPTICIS Q3 2025 Preliminary Earnings Report

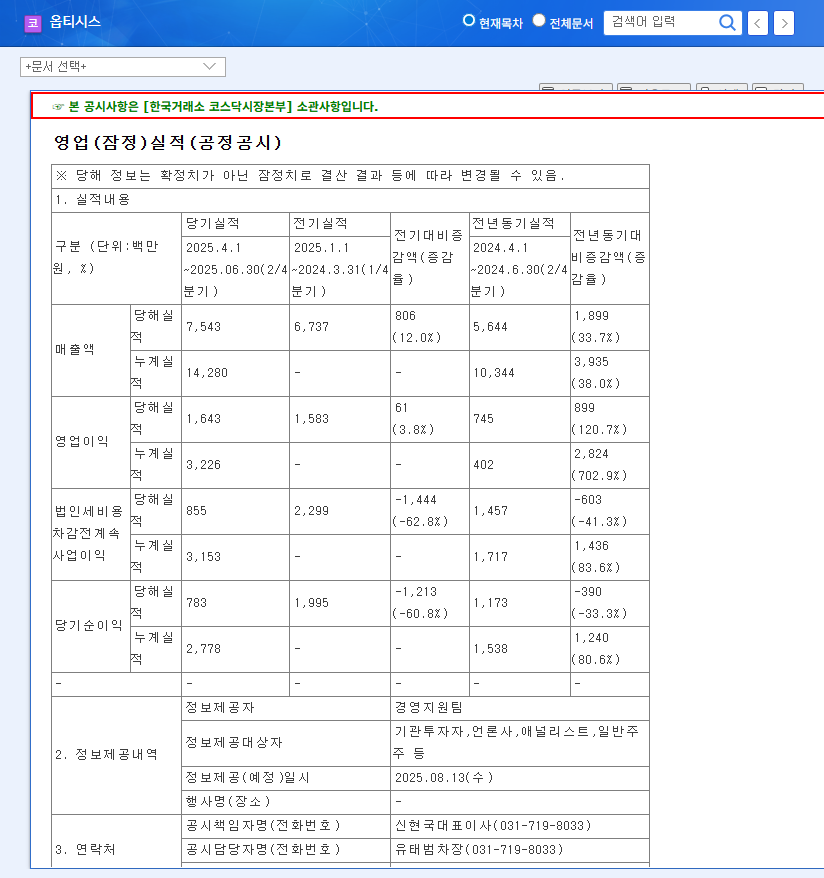
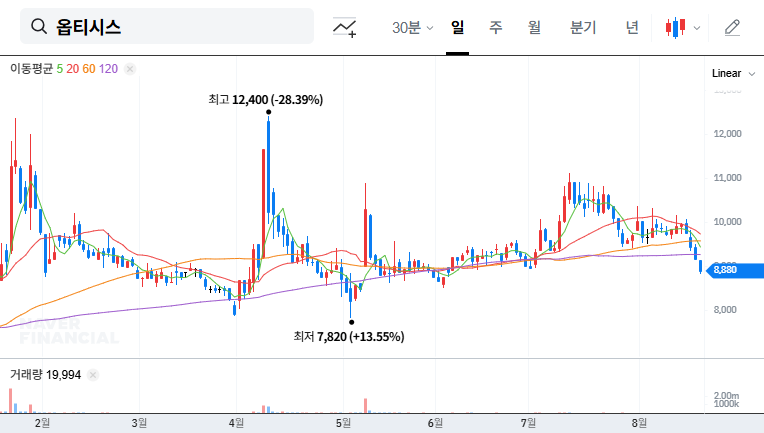
    On November 13, 2025, OPTICIS CO., LTD. released its preliminary financial results for the third quarter. The headline numbers, when compared to the strong performance in Q2 2025, show a noticeable contraction. The full details can be reviewed in the company’s Official Disclosure on the DART system.

    Key Financial Metrics (Q3 2025)

    • Revenue: KRW 5.1 billion (down from KRW 7.5 billion in Q2 2025)
    • Operating Profit: KRW 0.7 billion (down from KRW 1.6 billion in Q2 2025)
    • Net Income: KRW 1.3 billion (up from KRW 0.8 billion in Q2 2025)

    The sharp decrease in both revenue and operating profit is the primary concern for investors. However, the surprising increase in net income suggests that non-operating factors, such as gains from financial assets, played a significant role during the quarter. This divergence warrants a closer look beyond the top-line figures.

    While the quarter-over-quarter slowdown may cause short-term market apprehension, it’s crucial to weigh this against the company’s formidable financial health and long-term technological advantages.

    Core Strengths: Why OPTICIS Remains a Compelling Story

    Despite the Q3 dip, the foundational strengths of OPTICIS have not changed. A comprehensive OPTICIS stock analysis must consider these long-term value drivers, which provide a buffer against temporary market headwinds.

    Exceptional Financial Stability

    Based on its H1 2025 report, OPTICIS maintains a fortress-like balance sheet. A debt-to-equity ratio of just 7.07% and a current ratio exceeding 1,000% demonstrate outstanding financial soundness and liquidity. This stability allows the company to navigate economic downturns and continue investing in R&D without financial strain.

    Leading Technology in High-Growth Sectors

    OPTICIS is a key player in the high-speed optical transmission market, a critical technology for several expanding industries. With an export ratio of 78%, its global competitiveness is proven. The company’s proprietary technologies, including VCSEL, high-speed optical circuits, and advanced packaging, are protected by 65 intellectual property rights. This technological moat is crucial as demand surges in markets such as:

    • 4K/8K Displays: The core market where high-bandwidth video transmission is essential.
    • Medical Imaging: For high-resolution, real-time data transfer in operating rooms and diagnostics.
    • Automotive & Railway: Growing demand for reliable data links in advanced driver-assistance systems (ADAS) and transportation control.

    The company’s commitment to innovation is evident in its R&D spending, which accounts for over 9% of revenue. For a deeper look at the underlying technology, see our complete guide to optical transmission solutions.

    Investor Action Plan & Future Outlook

    The market’s reaction to the OPTICIS Q3 2025 earnings may create short-term price volatility. However, savvy investors should look beyond the immediate numbers and focus on the strategic picture. This report offers a chance to re-evaluate a long-term position.

    Key Indicators to Monitor Moving Forward

    • Q4 Guidance and Performance: The most critical question is whether Q3 was an anomaly. Watch closely for management commentary and the Q4 report to see if growth momentum is restored.
    • New Market Penetration: Track announcements and progress related to new contracts or design wins in the medical, automotive, or industrial sectors. These are key drivers for diversification and future growth.
    • Macroeconomic Factors: As a major exporter, OPTICIS is sensitive to currency fluctuations. The current depreciation of the Won could be a tailwind, but global high-interest rates and economic uncertainty remain risks, as noted by global economic analysts.

    In conclusion, while the Q3 preliminary earnings were underwhelming, they do not invalidate the long-term investment thesis for OPTICIS. The company’s superior financial health, technological leadership, and exposure to growing markets provide a strong foundation. Prudent investors should use this period to conduct thorough due diligence rather than making reactive decisions.

    (109080) OPTICIS Q3 2025 Earnings Analysis: Deep Dive into the Numbers & Future Outlook 관련 이미지
    (109080) OPTICIS Q3 2025 Earnings Analysis: Deep Dive into the Numbers & Future Outlook 관련 이미지
  • (120110) KOLON INDUSTRIES Q3 2025 Earnings: In-Depth Stock Analysis & Future Outlook

    (120110) KOLON INDUSTRIES Q3 2025 Earnings: In-Depth Stock Analysis & Future Outlook

    The latest KOLON INDUSTRIES earnings report for Q3 2025 has sent a mixed but intriguing signal to the market. While top-line revenue fell short of expectations, the company delivered a robust operating profit that beat consensus estimates by a significant margin. This divergence creates a complex picture for investors: is this a sign of impressive operational efficiency or a warning about underlying demand issues? This comprehensive analysis will dissect the KOLON INDUSTRIES financial results, explore the performance of its key divisions, evaluate potential risks, and provide a clear investment thesis for the future of KOLON INDUSTRIES stock.

    KOLON INDUSTRIES Q3 2025 Earnings: The Headline Numbers

    KOLON INDUSTRIES, INC. officially announced its preliminary consolidated financial results for the third quarter of 2025, revealing a narrative of resilience in profitability despite revenue challenges. The core figures present a classic ‘good news, bad news’ scenario that requires a closer look. For a complete financial breakdown, investors can view the Official Disclosure on DART.

    • Revenue: KRW 1,180.6 billion. This figure came in 3% below the market consensus of KRW 1,212.4 billion, indicating headwinds in market demand and volatility across some business segments.
    • Operating Profit: KRW 26.9 billion. In a significant positive surprise, this result surpassed market expectations of KRW 23.5 billion by a healthy 14%, highlighting strong internal cost controls and strategic focus.
    • Net Income: KRW 6.2 billion. This was slightly below the consensus of KRW 6.6 billion, likely influenced by non-operating factors such as foreign exchange losses or a higher tax burden, despite the strong operational performance.

    Decoding the Performance: The Story Behind the Numbers

    The central question from this KOLON INDUSTRIES earnings report is how the company managed to boost profitability while sales declined. The answer lies in its diversified business model and disciplined execution.

    The ability to outperform on operating profit in a challenging revenue environment is a testament to the company’s strategic shift towards high-value products and rigorous cost management. This operational excellence is a key factor in our current KOLON INDUSTRIES investment thesis.

    The Industrial & Chemical Powerhouse

    The star performers were the industrial and chemical materials segments. These divisions successfully offset weaknesses elsewhere. The chemical unit, in particular, benefited from rising demand for phenol resin and increased sales of advanced materials for 5G telecommunications infrastructure. The industrial materials division, which produces tire cords and advanced aramid fibers, continued to capitalize on the global expansion of the EV and autonomous driving markets. This diversification proves to be a critical strength for KOLON INDUSTRIES.

    The Persistent Drag: The Fashion Division’s Struggle

    Conversely, the fashion division remains a significant headwind. Softening domestic consumer sentiment in Korea has led to sustained declines in both revenue and operating profit for this segment. This consumer-facing business is weighing heavily on the company’s consolidated results and remains a key area of concern for investors analyzing the long-term outlook for KOLON INDUSTRIES stock.

    Investment Thesis: A Cautious ‘Hold’ Rating

    While the short-term reaction to the profit beat may be positive, the underlying revenue weakness and the structural issues in the fashion segment warrant a cautious approach. For investors, understanding both the potential upsides and the significant risks is crucial. New investors may benefit from our guide on how to analyze corporate earnings reports for more context.

    Positive Catalysts (The Bull Case)

    • Profitability & Efficiency: The company has proven it can protect its bottom line even when sales are difficult, a sign of strong management.
    • Growth Engine Alignment: The industrial and chemical divisions are perfectly aligned with major global trends like EVs, 5G, and advanced materials.
    • Stable Financials: A healthy debt-to-equity ratio of 90.3% provides a solid foundation to weather economic uncertainty and invest in future growth.

    Key Risk Factors (The Bear Case)

    • Fashion Division Underperformance: A continued downturn in consumer spending could lead to further deterioration and write-downs.
    • Macroeconomic Volatility: Rising raw material costs and unfavorable exchange rates (a weaker KRW increases import costs) could erode the hard-won profit margins, a risk faced by many global manufacturers as noted by sources like Reuters.
    • Global Economic Slowdown: A broader recession would inevitably dampen demand for the company’s core industrial materials, impacting all segments.

    Overall Assessment: ‘Hold’ with a 3.7/5 Rating

    Our investment opinion on KOLON INDUSTRIES stock is a ‘Hold’. The impressive operating profit and strength in future-facing industries are highly encouraging. However, these positives are balanced by the revenue miss and the unresolved issues in the fashion division. We recommend that investors monitor the company’s progress in turning around its fashion segment and watch for sustained top-line growth before committing new capital. A sharp rise in the stock price seems unlikely until a clearer, more consistent growth story emerges.

    (120110) KOLON INDUSTRIES Q3 2025 Earnings: In-Depth Stock Analysis & Future Outlook 관련 이미지
  • (216050) Incross Q3 2025 Earnings Analysis (216050): AI-Powered Profit Surge & Investment Outlook

    (216050) Incross Q3 2025 Earnings Analysis (216050): AI-Powered Profit Surge & Investment Outlook

    The latest Incross Q3 2025 earnings report has sent a strong signal to the market, revealing a remarkable quarter-over-quarter surge in profitability driven by strategic advancements in AI. Incross Co., Ltd. (216050), a key player in the digital marketing space, has demonstrated not just growth, but a significant enhancement of its operational efficiency, making this a pivotal moment for current and prospective investors. This comprehensive analysis will break down the preliminary results, explore the core drivers behind the success, assess the potential risks, and provide a clear investment outlook for the 216050 stock.

    On November 4, 2025, the company released its preliminary figures, which immediately caught the eye of analysts. The full details were released in an Official Disclosure, confirming the impressive growth trajectory.

    Deconstructing the Incross Q3 2025 Earnings Triumph

    While top-line revenue growth was steady, the real story lies in the company’s exploding profitability. The preliminary results showcase a company that is successfully translating its strategic initiatives into tangible financial gains. Here’s a closer look at the key metrics:

    • Revenue: KRW 11 billion, a healthy increase of 5.77% compared to the previous quarter.
    • Operating Profit: KRW 3.5 billion, a staggering surge of 59.09% QoQ, indicating major improvements in operational efficiency.
    • Net Income: KRW 3.5 billion, up an impressive 45.83% QoQ, reinforcing the strong bottom-line performance.

    This leap in operating profit is the headline figure. It suggests that Incross is not just winning more business, but is executing that business more profitably than ever before, a crucial indicator of a maturing and well-managed company.

    The AI Catalyst: Incross’s Strategic Growth Engine

    The cornerstone of Incross’s recent success is its dedicated focus on Incross AI technology. The company is moving beyond traditional digital advertising by integrating sophisticated AI to create value and efficiency. This strategy appears to be a primary driver of the margin expansion seen in the Q3 results.

    Key AI Initiatives Fueling Performance

    • Automation with LLM & RPA: By combining Large Language Models (LLMs) with Robotic Process Automation (RPA), Incross is automating complex marketing tasks. This reduces manual overhead, minimizes errors, and allows the team to focus on high-value strategy, directly contributing to higher operating profits.
    • ‘Stellize’ Content Platform: The launch of ‘Stellize’, an AI-based content marketing platform, represents a significant new revenue stream and a powerful tool for clients. It enables the creation of highly targeted, data-driven content at scale, a service in high demand. For more on this trend, see this report on AI’s role in modern marketing.

    The successful deployment of AI is no longer a future promise for Incross; it is a present-day reality reflected directly in their impressive Q3 2025 earnings and profit margins.

    Investor Action Plan: Weighing Opportunity and Risk

    A thorough Incross investment analysis requires balancing the stellar results against potential market and company-specific headwinds. While the short-term outlook is bullish, a prudent investor must consider all factors.

    Factors to Watch Closely

    While the growth story is compelling, certain risk factors require continuous monitoring:

    • Accounts Receivable: The company has a history of high accounts receivable and uncollected fees. While manageable, this poses a risk to cash flow and requires diligent management. Investors should look for improvements in this area in the full annual report.
    • Market Competition: The digital advertising landscape is fiercely competitive. Incross must continue to innovate with its AI technology to maintain its edge over larger and emerging rivals. Our internal analysis of the digital advertising market provides more context on this.
    • Macroeconomic Factors: Although interest rates are trending down, which is a positive, broader economic volatility can impact overall advertising budgets. Incross’s performance is still tied to the health of the global economy.

    In conclusion, the Incross Q3 2025 earnings report is a significant green flag. The company’s successful integration of AI is translating into exceptional profitability, suggesting strong upward momentum. For investors, the key will be to watch for sustained execution, concrete results from the ‘Stellize’ platform, and improved management of accounts receivable. Given its current market capitalization relative to its earnings growth, the 216050 stock presents a compelling case, but one that should be approached with a clear understanding of the associated risks.

    (216050) Incross Q3 2025 Earnings Analysis (216050): AI-Powered Profit Surge & Investment Outlook 관련 이미지
  • (013890) ZINUS INC. Q3 2025 Earnings Shock: A Deep Dive for Investors

    (013890) ZINUS INC. Q3 2025 Earnings Shock: A Deep Dive for Investors

    The recent news cycle for ZINUS INC. has been dominated by a significant development that has investors on high alert. While the company issued a minor correction to a business report filing, the true story lies within the bombshell release of its preliminary ZINUS INC. Q3 2025 earnings report. This report paints a concerning picture of the company’s current financial health, revealing a major revenue shortfall and an unexpected swing to an operating loss.

    This analysis will move beyond the administrative filing correction to dissect the critical details of the Q3 earnings, explore the underlying causes of this performance slump, and provide a comprehensive outlook for current and potential investors weighing their next move with Zinus stock.

    The Filing Correction vs. The Real Story

    It’s important to first clarify the nature of the business report correction submitted on March 12, 2025. This was a technical procedure involving adjustments to XBRL footnotes and content within financial statement notes to rectify system errors. This is not a material event impacting the company’s core business. The market’s attention, therefore, has rightly pivoted to the far more consequential release of the Q3 2025 preliminary earnings. For official details on the filing, you can view the Official Disclosure (DART).

    Unpacking the ZINUS INC. Q3 2025 Earnings Shock

    The preliminary results for Q3 2025 revealed a severe underperformance that caught the market by surprise, triggering what is commonly known as an ‘earnings shock’. The figures show a sharp deterioration not only against market consensus but also compared to previous quarters.

    The transition from a consistent operating profit in the first half of 2025 to a significant operating loss of KRW 7.8 billion in Q3 marks a critical inflection point, raising serious concerns among investors about the company’s near-term trajectory.

    Key Performance Metrics vs. Market Expectations

    • Revenue: KRW 241.7 billion, a staggering 19.4% below the market expectation of KRW 300 billion.
    • Operating Profit: KRW -7.8 billion. This represents a shocking reversal from the market’s anticipated profit of KRW 14.5 billion.
    • Net Income: KRW -10.1 billion, confirming the switch to a significant loss.

    Analyzing the Root Causes of the Slump

    The poor Q3 performance isn’t the result of a single factor but a confluence of internal vulnerabilities and external pressures. While macroeconomic indicators like stabilizing freight costs and favorable exchange rates should have provided some tailwinds, they were insufficient to counteract more fundamental issues.

    Core Business and Market Headwinds

    The core of the earnings deterioration appears to stem from a structural decline in revenue and profitability. Key contributing factors include:

    • Weakening Consumer Sentiment: Key markets, especially in North America, are experiencing a slowdown in discretionary spending, which directly impacts furniture and mattress sales. This aligns with broader market trends reported by sources like leading financial news outlets.
    • Major Client Order Restrictions: Zinus has a high reliance on specific large retail partners (accounting for 42.9% of sales in 2024). When these major clients restrict or reduce order volumes to manage their own inventory, Zinus’s performance is significantly impacted.
    • Increased Market Competition: The online ‘mattress-in-a-box’ market, which Zinus pioneered, has become increasingly saturated, putting pressure on pricing and market share.

    Investor Outlook: Short-Term Pain vs. Long-Term Potential

    The ZINUS INC. Q3 2025 earnings will undoubtedly cast a shadow on investor sentiment in the short term. However, a complete Zinus stock analysis requires balancing these immediate headwinds against the company’s long-term fundamental strengths. To gain a deeper understanding, investors may want to learn more about analyzing quarterly reports for deeper insights.

    Short-Term Risks to Consider

    • Negative Market Reaction: A sharp decline in stock price is anticipated as the market digests the earnings miss.
    • Analyst Downgrades: The significant discrepancy with market expectations could lead to target price downgrades from financial analysts.
    • Continued Uncertainty: Persistent macroeconomic uncertainty could delay the recovery in consumer spending.

    Long-Term Positive Factors

    • Robust Business Model: Zinus’s core strengths—its innovative ‘Mattress-in-a-box’ technology, leadership in the online furniture market, and vertically integrated supply chain—remain intact.
    • Synergy with Parent Group: Support and synergy from the Hyundai Department Store Group can provide financial stability and new growth avenues.
    • Global Expansion: The company’s capabilities for global expansion position it well to capitalize on an eventual market recovery.

    Investment Strategy: Navigating Zinus Stock

    Given the Q3 earnings shock, a cautious and patient approach is warranted. While the company’s long-term business model has merit, investors should wait for clear signs of an earnings turnaround before considering a new or expanded position. Key monitoring points include:

    • Future Earnings Reports: Closely watch Q4 2025 and 2026 earnings for evidence of stabilization and recovery.
    • Revenue Diversification: Look for strategic efforts to acquire new customers and reduce reliance on a few large clients.
    • Profitability Initiatives: Monitor the company’s plans to improve its cost structure and enhance efficiency to protect margins.

    In conclusion, while the business model’s long-term competitiveness is not fundamentally broken, the severity of the Q3 2025 earnings deterioration has significantly reduced Zinus’s short-term investment appeal. Prudence and diligent monitoring are the best strategies for now.

    (013890) ZINUS INC. Q3 2025 Earnings Shock: A Deep Dive for Investors 관련 이미지
  • (317450) MYUNGIN PHARM.CO., LTD Earnings (317450): Q3 2025 Analysis & Investment Outlook

    (317450) MYUNGIN PHARM.CO., LTD Earnings (317450): Q3 2025 Analysis & Investment Outlook

    The latest MYUNGIN PHARM.CO., LTD earnings release for Q3 2025 has sent a significant signal to the market. After two puzzling quarters of ‘zero’ operational performance, investors have been eagerly awaiting clarity on the company’s status. The silence is broken, and the numbers are compelling, but do they herald a sustainable recovery or a temporary reprieve? This in-depth analysis will dissect the Q3 results, explore the underlying fundamentals, and provide a comprehensive Myungin Pharm investment outlook to guide your decisions.

    The Dramatic Q3 2025 Turnaround

    On October 31, 2025, MYUNGIN PHARM.CO., LTD (317450) announced its preliminary third-quarter earnings, marking a stark contrast to the first half of the year. The company reported impressive figures: KRW 72.7 billion in revenue, KRW 21.3 billion in operating profit, and KRW 18.0 billion in net income. This announcement, detailed in their Official Disclosure, confirms that the core business operations of Myungin Pharm are not just active but thriving. The resulting operating profit margin of approximately 29.3% is robust for the pharmaceutical sector, suggesting efficient management and strong product positioning upon its return to market activity.

    The Q3 earnings report is the first concrete evidence that Myungin Pharm has navigated its operational challenges. The key question for investors now shifts from ‘if’ they will recover to ‘how sustainable’ this recovery is.

    Context: The Mystery of Q1 & Q2 and Underlying Strengths

    Addressing the ‘Zero’ Performance Anomaly

    The ‘zero’ earnings reported in Q1 and Q2 2025 created significant uncertainty. While the company has not yet provided a detailed official explanation, such a halt could be attributed to several factors, including a strategic operational overhaul, delays in major project revenue recognition, or complex accounting adjustments. The resumption of revenue generation in Q3 suggests the issue was temporary. However, for long-term investor confidence, a transparent explanation remains a critical missing piece of the puzzle.

    A Foundation of Solid Fundamentals

    Looking back at the 2024 audit report provides reassurance. Myungin Pharm entered 2025 on solid financial footing, receiving an unqualified audit opinion. Key indicators pointed to a healthy, growing business with strong core competitiveness. Total assets and equity grew by 11.5% and 12.6% respectively, driven by retained earnings. This financial buffer was likely instrumental in weathering the operational hiatus of early 2025. This history reinforces the idea that the company has the foundational strength to support the performance seen in the latest MYUNGIN PHARM.CO., LTD earnings report.

    Investment Outlook: Opportunities and Risks

    The Q3 results have reshaped the Myungin Pharm investment outlook, presenting both a compelling bull case and several points of caution that prudent investors must consider. For a broader view on market conditions, investors can consult resources like global economic forecasts from leading financial institutions.

    The Bull Case: A Resilient Turnaround Story

    • Operational Resumption Confirmed: The most significant positive is the undeniable proof of business activity. The company is generating substantial revenue and profit once again.
    • High Profitability: The strong profit margins suggest that the company’s core pharmaceutical products retain their pricing power and market demand.
    • Undervaluation Potential: Given the stock price decline preceding the announcement, the market may not have fully priced in this strong recovery, presenting a potential value opportunity. For more insights, you can review our guide to value investing in the pharma sector.

    The Bear Case: Lingering Uncertainties

    • Lack of Transparency: The primary risk is the unanswered question about the Q1/Q2 shutdown. Without clarity, investors may fear a recurrence, impacting long-term valuation.
    • One-Time Effect vs. Trend: Is this quarter’s performance sustainable? It could be inflated by pent-up demand or delayed shipments from the first half of the year. The Q4 results will be critical to establish a trend.
    • Macroeconomic Headwinds: Global economic volatility, including fluctuating currency exchange rates and interest rates, could impact costs for imported raw materials and affect profitability.

    Conclusion: A Strategic Approach for Investors

    The Q3 2025 MYUNGIN PHARM.CO., LTD earnings report is a powerful, positive inflection point. It demonstrates the company’s resilience and the enduring strength of its core business. However, the path forward requires careful monitoring.

    Short-Term: A cautious but optimistic stance is warranted. While the results are excellent, the market may wait for more data. Expect potential volatility as investors digest the news and await further communication from the company. A wait-and-see approach, observing the stock’s consolidation and recovery, is prudent.

    Mid-to-Long-Term: The outlook is promising if management provides transparency on past issues and confirms the sustainability of this performance in Q4. If Myungin Pharm can demonstrate consistent growth and rebuild trust, its solid fundamentals position it well for long-term appreciation. The key will be converting this single data point into a reliable growth narrative.

    (317450) MYUNGIN PHARM.CO., LTD Earnings (317450): Q3 2025 Analysis & Investment Outlook 관련 이미지
  • (489790) Hanwha Vision Q3 2025 Earnings Analysis: What Investors Need to Know

    (489790) Hanwha Vision Q3 2025 Earnings Analysis: What Investors Need to Know

    The latest Hanwha Vision Q3 2025 earnings report, released on October 31, 2025, has caused considerable concern among investors. The preliminary figures revealed a significant deviation from market consensus, with key metrics like revenue and operating profit falling well below expectations and the company swinging to a surprising net loss. This development has cast a shadow of uncertainty over Hanwha Vision’s short-term trajectory.

    This comprehensive Hanwha Vision analysis provides a meticulous breakdown of the Q3 2025 preliminary results. We will explore the underlying causes of this underperformance, assess the impact on the company’s core business segments, and offer a strategic guide for current and potential investors wondering what this means for Hanwha Vision stock.

    The Q3 2025 Earnings Shock: A Numbers Breakdown

    According to the company’s filing, the Q3 preliminary consolidated results painted a challenging picture. To understand the gravity of the situation, let’s look at the numbers against market expectations, which many analysts use as a benchmark for performance.

    Revenue Misses the Mark

    Hanwha Vision reported revenue of KRW 422.7 billion, a figure that was 17% lower than the market consensus of KRW 512.3 billion. This decline, when compared to the stronger performance in Q1 and Q2, suggests a potential deceleration in sales momentum heading into the latter half of the year.

    Operating Profit Plummets

    The most alarming figure was the operating profit, which came in at KRW 31.2 billion. This represents a staggering 41% shortfall compared to the expected KRW 52.8 billion. Such a sharp contraction in profitability is a major red flag, raising questions about cost controls, pricing power, and operational efficiency.

    The Unexpected Swing to a Net Loss

    Compounding the issue, the company reported a net loss of KRW 6 billion. While this is a slight improvement from the KRW -10.2 billion loss in Q2, swinging to a loss when the market anticipated a profit has understandably weakened investor confidence.

    The significant miss on both top and bottom lines suggests that the challenges facing Hanwha Vision may be more pronounced than previously understood, demanding a deeper analysis of its core operations.

    Why the Underperformance? A Segment-by-Segment Analysis

    To grasp the full picture of the Hanwha Vision Q3 2025 earnings, we must dissect the performance of its key business units.

    • Industrial Equipment Segment: It is highly probable that this segment was the primary contributor to the earnings decline. Directly exposed to the global economic slowdown and volatility in the semiconductor market, a delayed recovery or contraction here would heavily impact overall profitability.
    • Security Segment: While this division has been a consistent growth driver, the Q3 results raise the question of whether its momentum is slowing. Given its significant revenue contribution (87% from exports), any dip here would be consequential. A more detailed analysis of the global security market is needed to contextualize this performance.
    • Semiconductor Design Segment: As a future growth engine, its current revenue contribution is minimal. Therefore, its direct impact on this quarter’s results is likely limited. However, investors will be watching for progress in its R&D milestones.

    Investor Guide: Navigating the Path Forward

    The disappointing Q3 preliminary earnings will inevitably create short-term negative pressure on Hanwha Vision stock. A prudent Hanwha Vision investor should adopt a cautious and analytical approach.

    Key Factors to Monitor

    Before making any decisions, it is crucial to seek clarity. Investors should focus on the following points in the upcoming official reports and investor calls:

    • Detailed Segment Breakdown: Pinpoint the exact sources of the revenue and profit miss. Was it a sharp downturn in industrial equipment or a surprising slowdown in security? The official disclosure provides the raw data. (Source: DART)
    • Company’s Forward Guidance: Pay close attention to management’s forecast for Q4 2025 and the full year 2026. Their strategy for course correction will be critical.
    • Macroeconomic Indicators: Continue to monitor external factors like exchange rates (USD/KRW, EUR/KRW) and global industrial demand, which are crucial for an export-heavy company. For broader context, see economic analysis from high-authority sources like Bloomberg.

    Conclusion: A Test of Resilience

    While the Hanwha Vision Q3 2025 earnings are a clear setback, the company’s solid financial structure as of H1 2025 and its strong competitive position in the security market provide a buffer. The key to a turnaround lies in the sustained growth of its Security segment, fueled by AI and cloud innovations, and the eventual recovery of the Industrial Equipment market. For now, investors should prioritize diligent research and wait for a clearer picture to emerge from the company’s detailed financial reporting and future guidance.

    (489790) Hanwha Vision Q3 2025 Earnings Analysis: What Investors Need to Know 관련 이미지
  • (028050) SAMSUNG E&A Analysis (2025): Deep Dive on Earnings, Stock Outlook & Investment Value

    (028050) SAMSUNG E&A Analysis (2025): Deep Dive on Earnings, Stock Outlook & Investment Value

    A new SAMSUNG E&A analysis reveals a company at a pivotal moment, marked by two significant announcements that have captured investor attention. The firm recently enhanced its corporate transparency with a detailed business report correction filing while simultaneously releasing Q3 2025 preliminary earnings that, despite a revenue shortfall, showcased a surprising and robust beat on operating profit. These developments raise critical questions: What do these signals mean for the future of SAMSUNG E&A stock, and how should investors interpret this blend of news? This deep dive provides the essential insights needed for informed decision-making.

    Dual Developments: Transparency and Profitability

    Investors recently received two key updates from SAMSUNG E&A, each offering a unique lens through which to view the company’s current health and future trajectory. Let’s break down the core details of these events.

    A Commitment to Enhanced Transparency

    In a move to bolster investor confidence, SAMSUNG E&A submitted a comprehensive amended business report. This filing retroactively details the progress of approximately 20 major single sales and supply contracts dating from 2008 to 2024. By clarifying contract terms, project progress, and payment schedules, the company is significantly improving information transparency. This move was formalized in an official disclosure filed with the Financial Supervisory Service (Source: DART Report). For a company operating in the complex Engineering, Procurement, and Construction (EPC) sector, where projects span many years, this level of detail is a crucial signal of corporate governance and reliability.

    Q3 2025 Preliminary Earnings: A Mixed but Promising Picture

    The Q3 2025 preliminary Samsung E&A earnings report presented a nuanced story. While revenue missed targets, profitability shined through:

    • Revenue: KRW 1,995.6 billion, which was 11% below the market consensus of KRW 2,254.5 billion.
    • Operating Profit: KRW 176.5 billion, impressively 4% above the market expectation of KRW 168.9 billion.
    • Net Income: KRW 141.9 billion, closely aligning with the market forecast of KRW 142.7 billion.

    The key takeaway here is the divergence between revenue and profit. The operating profit beat suggests successful cost management, a focus on higher-margin projects, or both—a strong positive indicator for the company’s operational efficiency.

    Decoding the Financials: What This Means for SAMSUNG E&A Investment

    While the headlines provide a snapshot, a deeper Samsung E&A analysis is required to understand the long-term implications. The company’s fundamentals are showing a clear trend of recovery and are entering a new growth phase after a challenging deficit in 2022.

    A Deep Dive into Financial Health and Growth Metrics

    The financial trajectory indicates a robust turnaround. Operating profit is projected to see a steep improvement through 2025, driven by an impressive Q3 operating profit margin of 8.09%. This signals enhanced cost controls and a strategic pivot towards more lucrative projects. Key financial soundness indicators are also improving:

    • Profitability Ratios (ROE & ROA): Return on Equity (ROE) is forecast to climb from 0.49% in 2024 to 5.84% in 2025, showing vastly improved capital efficiency.
    • Debt-to-Equity Ratio: This key leverage metric is projected to decrease steadily to 49.38% by 2025, indicating a stronger, more resilient balance sheet.
    • Current Ratio: Expected to more than double from 40.58% to 81.48%, this improvement signals a significant strengthening of short-term liquidity and the ability to meet immediate obligations.

    Navigating the Macro-Economic Landscape

    No company operates in a vacuum, and external factors are critical to the SAMSUNG E&A investment thesis. An anticipated global trend of interest rate cuts could stimulate large-scale plant and infrastructure investments, which would be highly beneficial for SAMSUNG E&A’s new order pipeline. However, risks remain. Volatility in international oil prices, raw material costs, and currency exchange rates (Won/Dollar, Won/Euro) are significant variables that could impact project profitability. For a broader context, you can review our complete analysis of the global EPC market.

    Conclusion: An Investor’s Action Plan

    SAMSUNG E&A has successfully bolstered corporate credibility through its transparency initiatives and demonstrated operational resilience with its strong Q3 operating profit. The long-term financial projections point towards strengthening fundamentals, marked by recovering revenue, soaring profitability, and a much healthier balance sheet. While external market risks warrant careful monitoring, the company’s positive trajectory in the mid-to-long term is becoming increasingly clear. Industry trends also suggest a growing demand for complex engineering projects, a view supported by reports from leading analysts like Bain & Company.

    Disclaimer: This report is for informational purposes only and is not investment advice. All investment decisions should be made at the investor’s own discretion.

    Frequently Asked Questions (FAQ)

    What is the main takeaway from SAMSUNG E&A’s Q3 2025 earnings?

    Although revenue missed expectations, the operating profit beat them by 4%. This indicates strong profitability performance, likely resulting from improved cost management or a focus on high-margin projects.

    How is SAMSUNG E&A’s overall financial health?

    The company’s financial health is strengthening significantly. Key indicators like the debt-to-equity ratio are decreasing, while the current ratio (liquidity) is improving, signaling a more stable and resilient financial foundation.

    What are the primary risks for investors to watch?

    Key risks are external and include fluctuations in global oil prices, currency exchange rates, and general economic slowdowns that could delay large-scale project investments. Continuous monitoring of these macro trends is crucial.

    What does the business report correction filing mean for investors?

    This action enhances information transparency by providing detailed historical data on major contracts. It is a positive signal that builds corporate credibility and helps investors make more rational, data-driven decisions.

    (028050) SAMSUNG E&A Analysis (2025): Deep Dive on Earnings, Stock Outlook & Investment Value 관련 이미지
  • (267260) HD Hyundai Electric Earnings (Q3 2025): Profit Soars Past Forecasts | Stock Analysis for Investors

    (267260) HD Hyundai Electric Earnings (Q3 2025): Profit Soars Past Forecasts | Stock Analysis for Investors

    The latest HD Hyundai Electric earnings report for Q3 2025 has sent a clear and powerful message to the market: profitability is king. While revenue came in just shy of forecasts, the company delivered a stunning performance on both operating and net profit, significantly outperforming analyst expectations. This development raises crucial questions for current and potential investors about the true financial health of the company and the future trajectory of the HD Hyundai Electric stock price. This in-depth analysis will dissect the preliminary figures, explore the underlying drivers of this robust profitability, and provide a strategic roadmap for navigating your investment decisions moving forward.

    Q3 2025 Earnings Report: A Tale of Two Metrics

    On October 23, 2025, HD Hyundai Electric released its preliminary Q3 earnings, as per the official disclosure filed with DART (Official Disclosure). The market was met with a mixed but ultimately positive picture. While top-line revenue growth saw a minor dip against projections, the bottom-line results painted a portrait of exceptional operational efficiency and financial strength.

    Key Financials at a Glance

    • Revenue: KRW 995.4 billion, which was 2% below the consensus estimate of KRW 1,013.7 billion.
    • Operating Profit: KRW 247.1 billion, an impressive 7% above the estimate of KRW 230.7 billion.
    • Net Profit: KRW 191.1 billion, surging a remarkable 17% past the estimate of KRW 162.7 billion.

    The key takeaway for investors is clear: HD Hyundai Electric is demonstrating a powerful ability to convert sales into profit, a hallmark of a well-managed and resilient business.

    Unpacking the Profit Surge: What’s Driving the Growth?

    While the detailed breakdown is pending, the significant outperformance in operating and net profit suggests several positive factors at play. This level of profitability often stems from a combination of strategic successes, such as improved cost management, a favorable product mix tilting towards higher-margin offerings, and operational efficiencies gained through technology or process improvements. The slight revenue miss may point to specific market headwinds or project timing, but the company’s ability to absorb this and still deliver exceptional profits is a testament to its fundamental strength. This performance significantly bolsters the case for the long-term value of HD Hyundai Electric stock.

    The trend is not an anomaly. A review of performance over the last year shows a consistent upward trajectory in profitability, with both operating and net profit margins showing continuous improvement since Q3 2024. This pattern signals sustainable growth rather than a one-time event, which is a critical factor for any serious investor analysis.

    Market Outlook and Stock Price Implications

    The market generally rewards profitability. The strong earnings beat is likely to be viewed as a significant positive catalyst by analysts and investors. We can anticipate positive revisions to earnings forecasts and potential upgrades to stock price targets in the coming weeks. For context on broader market sentiment, it’s always wise to consult leading financial news sources like Reuters or Bloomberg for macroeconomic trends.

    However, the revenue shortfall, though minor, will prevent unchecked euphoria. The market will be keen to understand the reasons behind it. This makes the upcoming official conference call and detailed filings crucial. Investors should monitor how the stock price reacts in the immediate aftermath and whether it can build and sustain momentum. For more foundational knowledge, consider reviewing our guide on how to analyze quarterly earnings reports.

    Actionable Strategy for Investors

    Given this positive yet nuanced HD Hyundai Electric earnings report, a prudent and informed approach is essential. Here are the key steps to take:

    Your Due Diligence Checklist

    • Await Analyst Reports: Keep a close eye on reports from major brokerages. Look for revised earnings-per-share (EPS) estimates, updated price targets, and detailed commentary on segment performance.
    • Review Official Filings: Dive deep into the full corporate disclosure materials when they become available. This will provide granular detail on what drove the profit beat and caused the revenue miss.
    • Analyze Profit Drivers: Pinpoint the specific factors behind the margin expansion. Was it reduced raw material costs, higher pricing power, or internal cost-cutting? Understanding this is key to forecasting future performance.
    • Monitor Market Reaction: Track the stock’s price action and trading volume in the days following the announcement. A strong, sustained rally on high volume is a bullish sign, while a muted or volatile reaction may signal investor uncertainty.

    In conclusion, the Q3 2025 preliminary results for HD Hyundai Electric are overwhelmingly positive from a profitability standpoint. This demonstrates a resilient and efficient operational model. While the revenue figure warrants further investigation, the impressive bottom-line performance should give investors confidence in the company’s core financial health. By conducting thorough follow-up research, you can position yourself to make a well-informed and strategic investment decision.

    (267260) HD Hyundai Electric Earnings (Q3 2025): Profit Soars Past Forecasts | Stock Analysis for Investors 관련 이미지
  • Phacell Bio (323990) Q2 2025 Earnings Surprise: KRW 1.7 Billion in Revenue, Investment Analysis

    1. What Happened: Phacell Bio’s Q2 2025 Earnings Release

    Phacell Bio announced its Q2 2025 earnings on August 28, 2025. The key highlights are:

    • Revenue: KRW 1.7 Billion (Expected: KRW 0)
    • Operating Income: KRW -4.3 Billion (Expected: KRW 0)
    • Net Income: KRW -2.6 Billion (Expected: KRW 0)

    2. Why It Matters: Exceeding Expectations, Potential for Successful Diversification

    This performance significantly surpasses market expectations. Notably, it suggests growth potential in Phacell Bio’s companion animal healthcare business (‘Paxleukin-15’) and pharmaceutical distribution business, indicating that the company’s diversification strategy is yielding tangible results.

    3. What’s Next: Outlook and Investment Considerations

    Despite the positive revenue growth, the continued operating loss remains a challenge. Investors should focus on the following:

    • Continued performance of the companion animal healthcare business
    • Clinical progress of key anti-cancer immunotherapy pipelines
    • Securing financial soundness and managing regulatory risks

    4. Investor Action Plan: Focus on Key Metrics for Long-Term Growth

    When considering investing in Phacell Bio, focus on the long-term growth potential rather than short-term stock price fluctuations. Continuously monitoring clinical trial results of key pipelines, the performance of business diversification, and financial soundness indicators is crucial for developing a robust investment strategy.

    Frequently Asked Questions (FAQ)

    Why did Phacell Bio’s Q2 earnings outperform expectations?

    Strong sales of the companion animal anticancer drug ‘Paxleukin-15’ and growth in the pharmaceutical distribution business are considered the main drivers.

    Is it safe to invest despite the continued operating loss?

    Investment decisions should be made by comprehensively considering revenue growth trends, clinical progress of key pipelines, and financial soundness indicators.

    What are Phacell Bio’s main pipelines?

    ‘Vax-NK,’ targeting hepatocellular carcinoma and small cell lung cancer, and ‘Vax-CAR,’ targeting hematologic and solid cancers, are among the key pipelines.

  • Youngjin Pharm’s Q2 2025 Earnings Surprise: A Deep Dive and Investment Outlook

    1. Youngjin Pharm’s Q2 2025 Earnings: What are the key figures?

    Youngjin Pharm reported sales of KRW 62.5 billion, operating profit of KRW 1.8 billion, and net income of KRW 0.3 billion for Q2 2025, significantly exceeding market expectations.

    2. Drivers of Growth: What fueled the strong performance?

    The robust performance is attributed to steady progress on existing supply contracts with UBE Corporation and MYLAN SEIYAKU LTD, along with increased transparency through amendments to the business report. The continued growth trajectory since turning profitable in 2024 is particularly encouraging.

    3. Outlook and Investment Strategies: How should investors approach this?

    The company’s expansion into the Chinese market, pending regulatory approvals, is a key factor that could significantly impact future earnings. Macroeconomic factors such as exchange rates and interest rates also warrant close monitoring. A prudent investment approach should consider both the positive aspects and potential risks.

    • Positive Factors: Exceeded market expectations, Stable supply contract execution, Improved fundamentals
    • Risk Factors: Uncertainty surrounding Chinese market approval, Macroeconomic variables

    4. Key Checkpoints for Investors

    Before making any investment decisions, investors should carefully review the final earnings release and related disclosures, and consider consulting with financial professionals.

    Frequently Asked Questions

    What are the key takeaways from Youngjin Pharm’s Q2 earnings?

    The company significantly outperformed market expectations and demonstrated continued improvement in fundamentals.

    What investment strategies should be considered?

    Investors should exercise caution, considering the pending Chinese market approval and macroeconomic factors.

    What information should investors review before making a decision?

    It is recommended to review the final earnings release, related disclosures, and consult with financial professionals.