Tag: FX Risk

  • (285490) NOVATECH Shareholding Report: A Deep Dive Analysis for Investors (2025)

    (285490) NOVATECH Shareholding Report: A Deep Dive Analysis for Investors (2025)

    The latest NOVATECH Shareholding Report has caught the attention of the investment community, revealing key insights into the company’s leadership and stability. While the report, filed on November 14, 2025, shows no change in CEO Oh Chun-taek’s significant 54.28% stake, the nuances behind this filing warrant a much deeper look. This comprehensive NOVATECH stock analysis will unpack the report’s implications, weigh management stability against current performance challenges, and provide a clear roadmap for potential and current investors.

    We’ll explore NOVATECH’s financial health, the macroeconomic headwinds it faces, and what strategic moves investors should be monitoring in the coming quarters.

    Deconstructing the Shareholding Report

    What Did the Report Actually Say?

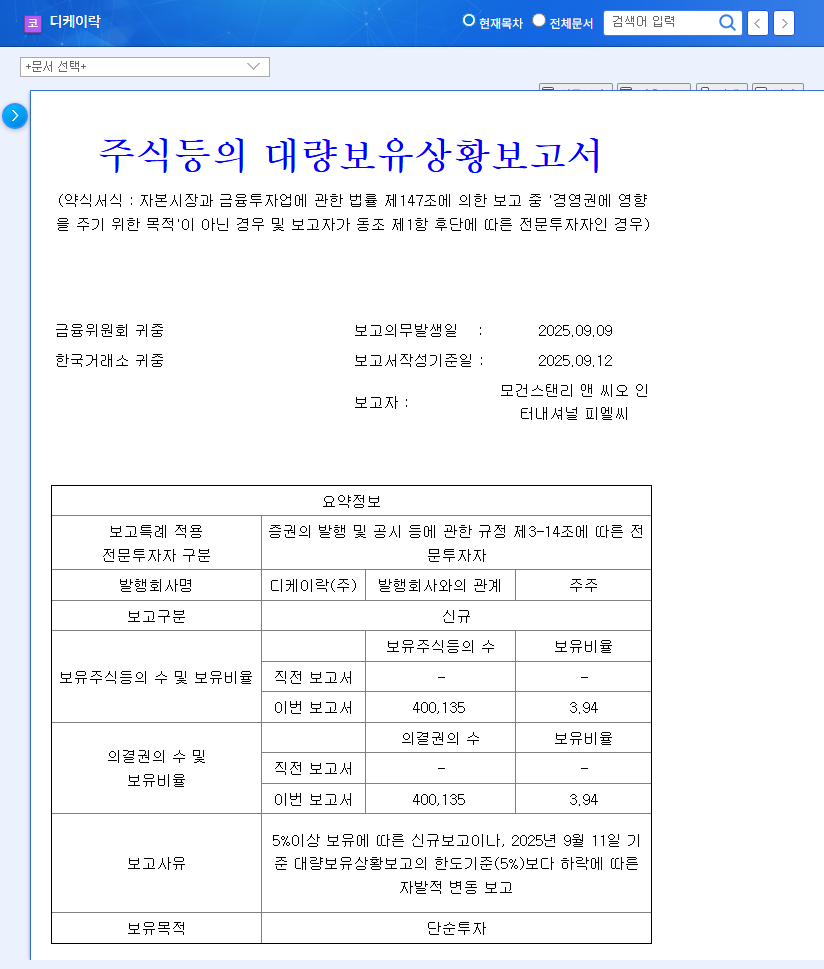
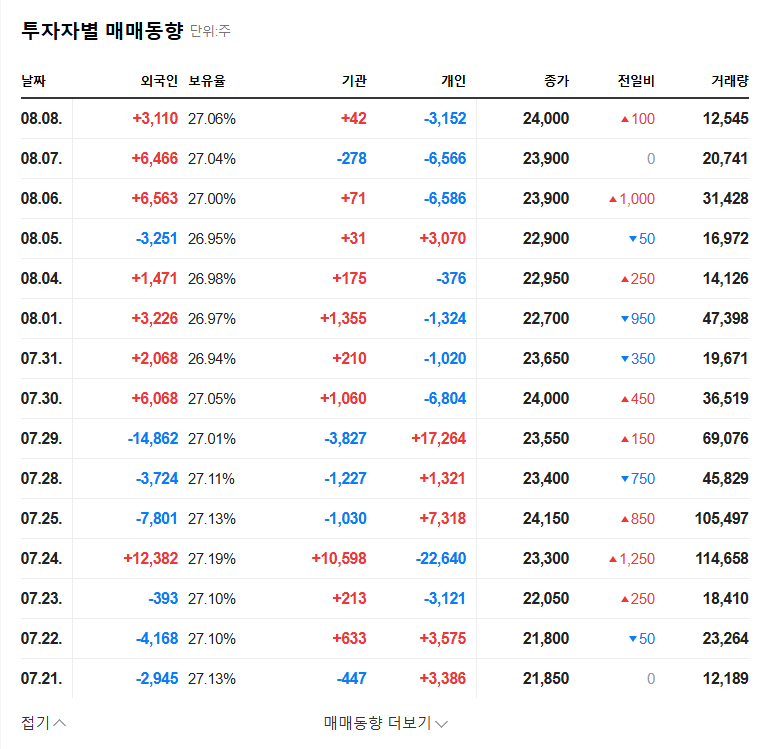
    On November 14, 2025, NOVATECH Co., Ltd. filed its ‘Report on the Status of Large Shareholdings, etc.’. The key figure, CEO Oh Chun-taek, confirmed his holding of 54.28% of the company’s shares. The official purpose cited was ‘management influence,’ reinforcing his long-term commitment. Crucially, the filing reason was noted as ‘on-market trading and collateral contract change (extension).’ The full filing can be reviewed in the Official Disclosure (DART).

    While ‘no change’ might sound uneventful, the extension of a collateral contract is significant. It suggests the CEO is using his shares as collateral for financing, and the extension indicates a stable, ongoing relationship with lenders, mitigating risks of a forced sale and reinforcing financial stability at the leadership level.

    A majority stake held firmly by the CEO is a powerful signal of management stability. However, this stability must be weighed against the company’s real-world performance and market challenges.

    NOVATECH Financial Health & Market Pressures

    A Mixed Performance Picture

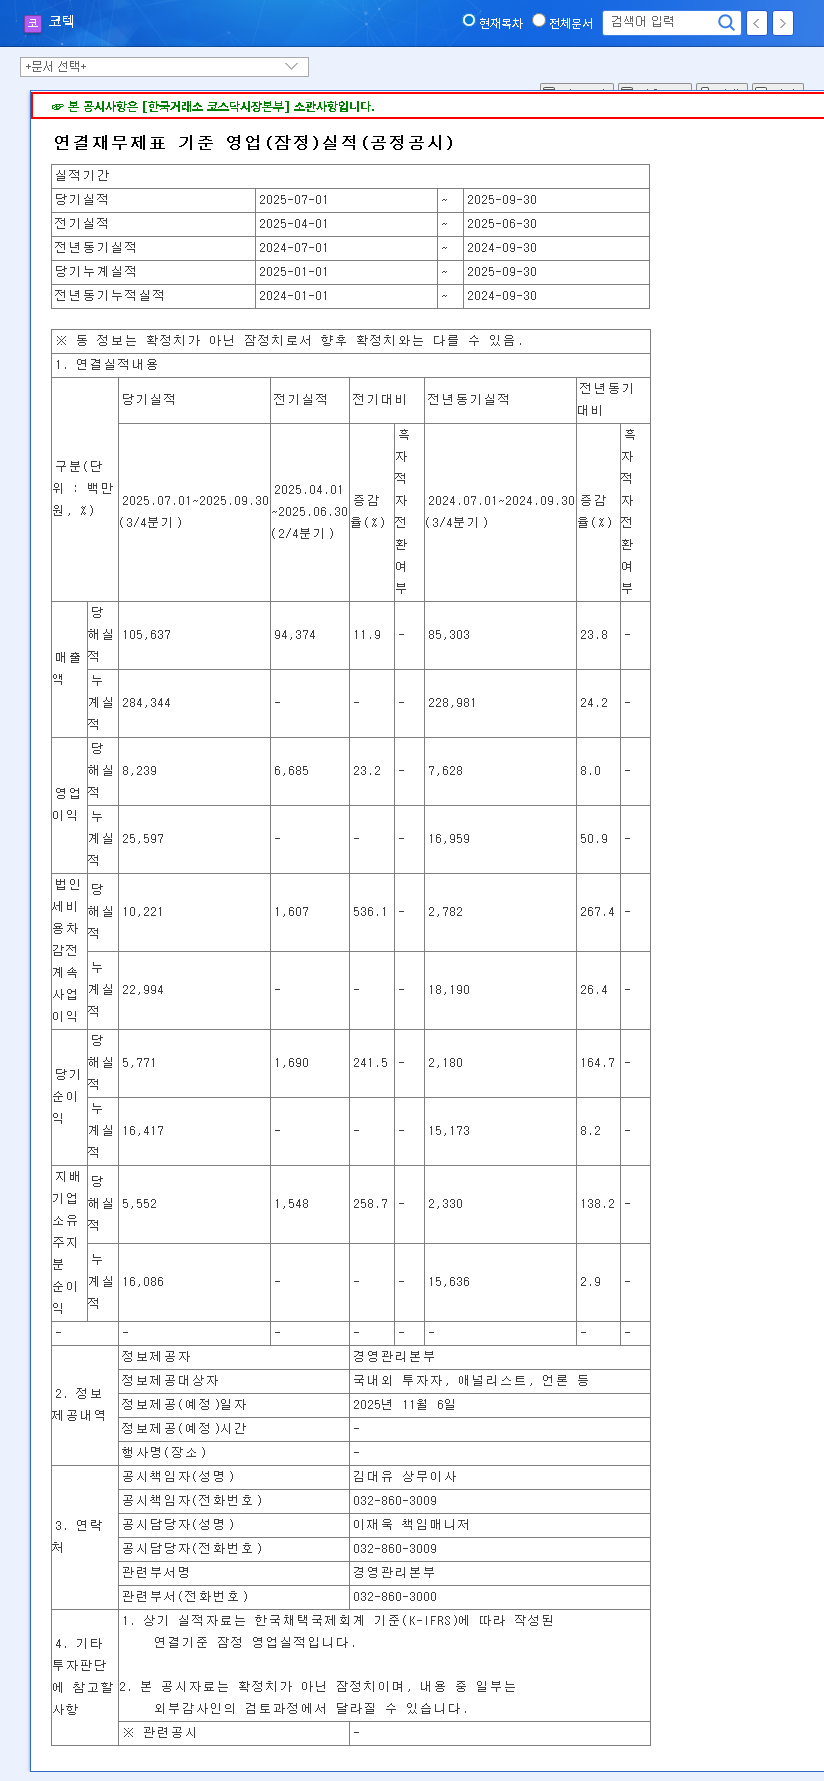
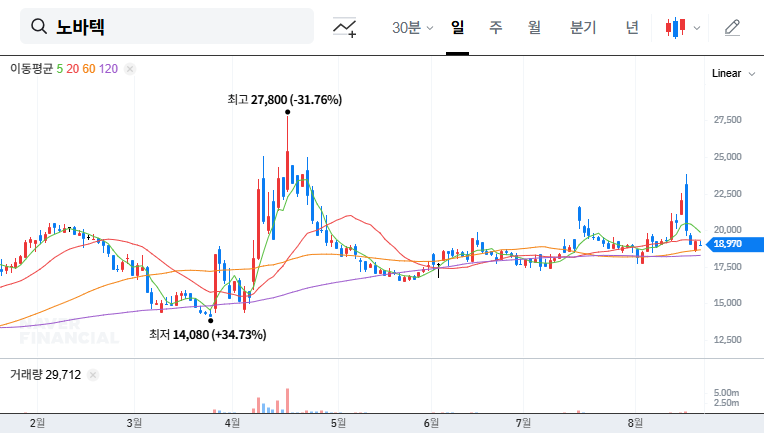
    An honest NOVATECH stock analysis must acknowledge the recent performance dip. In the first half of 2025, revenue fell to KRW 29.2 billion (a 5.2% YoY decrease), while operating profit saw a more significant drop to KRW 5.63 billion (-20.3% YoY). This was attributed mainly to reduced sales of general shielding magnets. However, the company is not standing still. An uptick in core material sales shows a positive trend in portfolio diversification.

    Despite the profit decline, NOVATECH’s financial health remains exceptionally robust. Key indicators include:

    • Low Debt: A remarkably low debt-to-equity ratio of just 5.45% signals minimal financial risk.
    • Strong Cash Flow: Operating cash flow improved dramatically to KRW 13.402 billion, a testament to efficient operations.
    • Commitment to Innovation: R&D spending at 4.1% of sales demonstrates a focus on future growth and technological competitiveness. Interested readers can learn more by reading about how to analyze tech company R&D spending.

    Global Exposure and FX Volatility

    With a staggering 95% of its sales generated overseas, NOVATECH’s performance is intrinsically linked to the global economic climate and currency fluctuations. The company’s sensitivity is acute: a mere 10 KRW change in the USD/KRW exchange rate can swing profits by approximately KRW 1.845 billion. As the USD/KRW rate hovers near KRW 1,458, effective currency hedging is not just a strategy—it’s a necessity. Investors should monitor global economic trends, such as those reported by authoritative sources like Reuters, to anticipate potential impacts on NOVATECH.

    Investor Takeaways & Strategic Outlook

    This NOVATECH Shareholding Report is a vote of confidence in management’s long-term vision. However, the market demands more than just stability; it demands growth. For a prudent investment strategy, here are the key areas to monitor:

    • Turnaround in Profitability: Watch for a rebound in revenue and operating profit. Can the growth in core materials offset the decline in legacy products and drive the company forward?
    • FX Risk Management: Scrutinize quarterly reports for comments on the company’s hedging strategies and their effectiveness against currency volatility.
    • R&D Pipeline: Look for announcements of new products or patents resulting from their consistent R&D investment. This is the primary source of new growth engines.
    • Global Market Health: Keep an eye on the economic health of key export markets, as this will directly influence sales volumes.

    In conclusion, while the report confirms rock-solid management stability, the true catalyst for NOVATECH’s stock will be a clear demonstration of performance recovery and innovation-led growth. A long-term, analytical approach is essential.

    Frequently Asked Questions

    What does the CEO’s 54.28% stake signify?

    It signals an exceptionally high level of management stability and a strong, long-term commitment from the company’s leader, Oh Chun-taek. It aligns his interests directly with those of shareholders.

    Is NOVATECH’s recent performance a cause for concern?

    The H1 2025 decline in revenue and profit is a challenge that needs to be monitored. However, the company’s excellent financial health (low debt, strong cash flow) provides a solid foundation to navigate this period and invest in future growth.

    What are the biggest risks for NOVATECH investors?

    The two primary risks are its high dependency on overseas sales, making it vulnerable to global economic downturns, and its sensitivity to foreign exchange rate fluctuations, which can directly impact profitability.

    (285490) NOVATECH Shareholding Report: A Deep Dive Analysis for Investors (2025) 관련 이미지
  • (051360) TOVIS Stock Forecast (051360): Automotive Display Growth & Insider Buying Signal Upside

    (051360) TOVIS Stock Forecast (051360): Automotive Display Growth & Insider Buying Signal Upside

    This comprehensive TOVIS stock forecast delves into the recent performance and future potential of global display solutions provider TOVIS Co., Ltd. (051360). With a strong performance in the first half of 2025, fueled by its booming TOVIS automotive display division, the company is capturing significant market attention. Adding to the bullish sentiment, recent disclosures reveal that the company’s major shareholder has increased their stake, a classic sign of insider confidence. This analysis will dissect TOVIS’s fundamentals, the implications of these key events, and provide a detailed outlook for investors considering this burgeoning tech stock.

    We’ll examine whether these positive catalysts are enough to propel TOVIS’s corporate value and stock price to new heights, providing the critical information needed for well-informed investment decisions.

    Key Catalysts: H1 2025 Performance & Shareholder Confidence

    Two major developments have placed TOVIS (051360) in the spotlight: exceptional financial results and a significant vote of confidence from its largest shareholder. These events provide a solid foundation for our TOVIS stock analysis.

    1. Robust H1 2025 Financial Performance

    The company’s semi-annual report paints a picture of robust health and strategic success:

    • Impressive Earnings: TOVIS reported revenue of KRW 320.1 billion, an operating profit of KRW 30.4 billion, and a net profit of KRW 20.3 billion, showcasing significant year-over-year growth.
    • Automotive Division Shines: The TOVIS automotive display business was the star performer, exhibiting high growth and cementing its role as the company’s primary future growth engine.
    • Stable Industrial Base: The industrial monitor division, a long-standing cash cow, continued its stable growth trajectory thanks to a well-diversified product portfolio.

    2. Major Shareholder Increases Stake, Signaling Strong Belief

    In a significant move, major shareholder Yong-Beom Kim and related parties acquired an additional 0.46% of the company through on-market purchases in November 2025. This increased their total holding from 15.26% to 15.72%. This action, confirmed in the Official Disclosure, is widely interpreted by analysts as a powerful vote of confidence in the company’s long-term strategy and growth potential.

    Insider buying by a major shareholder is one of the strongest positive signals for investors, suggesting that those with the most information are bullish on the company’s future prospects.

    Why This Matters: Dissecting TOVIS’s Core Strengths

    These events are particularly meaningful because they build upon TOVIS’s already solid business foundation. The synergy between its growth engine and its stable core business creates a compelling investment thesis.

    The Power of the Automotive Display Market

    The automotive sector is undergoing a massive transformation, often summarized by the MECA trend (Mobility, Electrification, Connectivity, Autonomous). This shift, detailed by leading analysts at top consulting firms, places digital displays at the heart of the modern vehicle. TOVIS is perfectly positioned to capitalize on this, supplying advanced infotainment systems and digital instrument clusters. Continued investment in next-generation technologies like OLED and Scenic View HUDs further solidifies its competitive advantage.

    Solid Financials and Reasonable Valuation

    TOVIS maintains a healthy balance sheet, with a stable debt-to-equity ratio of 94.6% and improving operating cash flow. Its current valuation, with a PER of 20.3x and a PBR of 0.94x, reflects its growth trajectory while still offering potential for upside as its ROE improves. This financial stability is crucial for navigating market volatility, a topic we cover in our broader analysis of the tech hardware sector.

    Potential Risks and Headwinds

    Despite the positive outlook, no investment is without risk. Prospective investors in TOVIS should monitor the following factors:

    • Foreign Exchange Volatility: With a high export ratio, fluctuations in the KRW against the USD and EUR can significantly impact net profit. The company estimates a 5% currency change could alter net profit by ~KRW 1.16 billion.
    • Macroeconomic Pressures: A global economic slowdown, persistent inflation, or rising interest rates could dampen consumer demand for new vehicles and affect the industrial sector.
    • Competitive Landscape: The display market is intensely competitive, requiring continuous innovation and R&D investment to stay ahead.

    Investor Action Plan: A ‘Buy’ Recommendation for TOVIS

    Considering the powerful growth in the TOVIS automotive display segment, strong fundamentals, and the significant vote of confidence from the TOVIS major shareholder, our TOVIS stock forecast concludes with a ‘BUY’ rating.

    The company represents an attractive investment with a clear path to continued growth and stock price appreciation. Key points to monitor going forward include order flow for the automotive division, the impact of currency hedging strategies, and the commercialization timeline for its next-generation display technologies.

    Frequently Asked Questions (FAQ)

    What are the main business segments of TOVIS Co., Ltd.?

    TOVIS operates two primary business segments: industrial monitors (used in gaming, medical, and aviation) and automotive displays (for vehicle infotainment systems and instrument clusters).

    Why is the TOVIS major shareholder’s stake increase important?

    An increase in stake by insiders is a strong positive signal. It enhances management stability and shows that those with the most intimate knowledge of the company are confident in its future growth and stock performance.

    What are the primary growth drivers for a positive TOVIS stock forecast?

    The key growth drivers are the rapid expansion of the automotive display market due to the MECA trend and the company’s ongoing R&D in next-generation technologies like OLED and Scenic View HUDs.

    (051360) TOVIS Stock Forecast (051360): Automotive Display Growth & Insider Buying Signal Upside 관련 이미지
  • (105740) DK-Lok Corporation Q3 2025 Earnings Analysis: A Definitive Rebound or False Dawn?

    (105740) DK-Lok Corporation Q3 2025 Earnings Analysis: A Definitive Rebound or False Dawn?

    The latest DK-Lok Corporation Q3 2025 earnings report, released on November 11, 2025, sent a significant ripple through the market. After a challenging second quarter, the company posted a remarkable turnaround with impressive revenue and profit figures. But does this signal a sustainable recovery and a new growth phase, or is it merely a temporary reprieve from underlying issues? This comprehensive DK-Lok financial analysis will dissect the quarterly results, explore the positive catalysts and persistent risks, and provide a clear investment outlook for the future.

    Breaking Down the DK-Lok Corporation Q3 2025 Earnings Report

    DK-Lok Corporation announced a significant performance rebound in its preliminary third-quarter results, a stark contrast to the sluggish performance seen in Q2 2025. The numbers paint a picture of a company returning to strong profitability. The official data can be reviewed in the company’s disclosure. (Source: Official Disclosure).

    Key Financial Highlights (Consolidated)

    • Revenue: 37.6 billion KRW (up from 30.6 billion in Q2)
    • Operating Profit: 6.7 billion KRW (a significant swing from 0.3 billion in Q2)
    • Net Profit: 7.8 billion KRW (a dramatic recovery from a -4.3 billion loss in Q2)

    The most striking figure is the operating profit margin, which soared to approximately 17.8%, a massive leap from the razor-thin 0.98% margin in the previous quarter. This suggests a powerful combination of increased sales volume, better cost controls, or a more favorable product mix.

    The Bull Case: Catalysts for Sustained Growth

    Solid Domestic Demand & Global Competitiveness

    Even before this quarter, DK-Lok showed strength in its home market, with domestic sales growing 15.11% in the first half of 2025. This provides a stable foundation. Crucially, the company is not just a domestic player. With an export ratio of approximately 74%, DK-Lok has proven its ability to compete and win on the global stage against industry giants, demonstrating the quality and cost-effectiveness of its precision fittings and valves.

    Future-Proofing through High-Growth Industries

    DK-Lok is actively positioning itself at the forefront of technological innovation. The company’s focus on new product development for high-growth sectors is a key pillar of its long-term strategy. This includes:

    • Hydrogen: Developing specialized valves and fittings capable of handling the high pressures and unique properties of hydrogen gas for fueling stations and transport.
    • Electric Vehicles (EVs): Supplying components for battery cooling systems and other fluid management applications within EV manufacturing.
    • Semiconductors: Providing ultra-high-purity (UHP) fittings and valves essential for the manufacturing of next-generation microchips.

    While the Q3 turnaround is impressive, the core question for investors is whether the fundamental issues, particularly with the overseas subsidiary, have been resolved or simply masked by a strong quarter.

    The Bear Case: Persistent Risks and Headwinds

    The Drag from Overseas: VALVOMETAL ITALY

    The primary cause of the consolidated net loss in the first half of 2025 was the significant underperformance of its Italian subsidiary, VALVOMETAL ITALY. The Q3 report does not specify if this subsidiary’s profitability has fundamentally improved. Without a structural fix, this remains a major source of potential volatility that could erase gains in future quarters. Investors should seek clarity on the turnaround plan for this specific unit.

    Financial and Macroeconomic Pressures

    Several financial metrics warrant caution. Inventory levels rose significantly to 59.38 billion KRW, which could signal sales forecasting issues or tie up valuable cash. Additionally, increased borrowing for factory expansion, while necessary for growth, adds to financial risk, especially in a rising interest rate environment. The company is also highly sensitive to foreign exchange volatility; a 5% swing in exchange rates could impact pre-tax profit by over 2.1 billion KRW. For more on this, investors can read about managing currency risk in international stocks.

    Investment Outlook and Final Verdict

    The strong DK-Lok Corporation Q3 2025 earnings create a positive short-term narrative. However, a prudent DK-Lok investment strategy requires a long-term view. The positive momentum from new growth sectors is promising, but it’s weighed down by the unresolved issues at its Italian subsidiary and various financial pressures. As reported by leading financial news outlets like Bloomberg, market sentiment often depends on the sustainability of such turnarounds.

    Therefore, our DK-Lok stock outlook remains “Neutral.” An upgrade to a more bullish stance would be contingent on clear evidence of:

    • A sustainable turnaround in the profitability of VALVOMETAL ITALY.
    • Effective management and reduction of elevated inventory levels.
    • Tangible revenue contributions from the hydrogen, EV, and semiconductor initiatives.

    Frequently Asked Questions (FAQ)

    Q1: How did DK-Lok Corporation perform in Q3 2025?

    A1: DK-Lok Corporation showed a significant rebound in Q3 2025, reporting revenue of 37.6 billion KRW, operating profit of 6.7 billion KRW, and net profit of 7.8 billion KRW. This marked a successful return to profitability after a difficult second quarter.

    Q2: What are the key risks for a DK-Lok investment?

    A2: The primary risks include continued losses from its overseas subsidiary (VALVOMETAL ITALY), the impact of high currency exchange rate volatility, the financial burden from high inventory levels, and increased borrowing for expansion.

    Q3: What are DK-Lok Corporation’s long-term growth drivers?

    A3: Long-term growth is expected to come from its strong global export market and strategic product development in high-growth industries, including hydrogen, electric vehicles, and semiconductors, which require specialized, high-quality fittings and valves.

    (105740) DK-Lok Corporation Q3 2025 Earnings Analysis: A Definitive Rebound or False Dawn? 관련 이미지
    (105740) DK-Lok Corporation Q3 2025 Earnings Analysis: A Definitive Rebound or False Dawn? 관련 이미지
  • (043150) VATECH Q3 2025 Earnings Analysis: Profit Misses Forecasts | Stock Outlook & Investor Guide

    (043150) VATECH Q3 2025 Earnings Analysis: Profit Misses Forecasts | Stock Outlook & Investor Guide

    VATECH Q3 2025 Earnings: A Mixed Report Card

    ValueAddedTechnologyCo.,Ltd. (VATECH), a formidable force in the global dental imaging market, has released its preliminary financial results, and the market is paying close attention. The VATECH Q3 2025 earnings report paints a complex picture, showcasing resilient revenue growth on one hand while revealing an unexpected dip in profitability on the other. This divergence has created a mix of optimism and caution among investors. This comprehensive analysis will dissect the report, explore the underlying fundamentals, and provide a strategic outlook for those monitoring VATECH stock.

    While top-line growth signals healthy demand, the bottom-line miss raises critical questions about cost pressures, operational efficiency, and the immediate future of VATECH’s stock performance.

    The Numbers at a Glance: Key Financials

    On November 10, 2025, VATECH officially disclosed its preliminary Q3 consolidated financial results (Source: DART Official Disclosure). The key figures against market consensus are as follows:

    • Revenue: KRW 100.1 billion, a 1.2% beat over the KRW 98.9 billion expectation.
    • Operating Profit: KRW 12.4 billion, an 11.4% miss below the KRW 14.0 billion forecast.
    • Net Profit: KRW 13.9 billion, a significant 13.1% miss below the KRW 16.0 billion expectation.

    The primary takeaway from these VATECH financial results is clear: while the company’s sales engine is running smoothly, its profitability has hit a speed bump. This disconnect demands a deeper dive into the contributing factors.

    Analysis: Why the Mixed Results?

    Several factors could be contributing to the margin compression seen in the VATECH Q3 2025 earnings. While the company has not detailed every cause, a thorough VATECH stock analysis must consider potential internal and external pressures.

    Potential Headwinds on Profitability

    • Raw Material Costs & Supply Chain: Fluctuations in the prices of key components like sensors and X-ray tubes can directly impact the cost of goods sold. Lingering global supply chain inefficiencies may also contribute to higher logistical expenses.
    • Increased R&D and Marketing Spend: The recent launch of the FDA-approved ‘Green X 21’ and the strategic AI partnership with Pearl likely required significant upfront investment in research, development, and marketing to penetrate the competitive North American market.
    • Exchange Rate Volatility: As a major exporter, VATECH’s profits are sensitive to currency fluctuations. While a strong USD can be beneficial, hedging costs or unfavorable shifts in other currencies (EUR, CNY) could have negatively impacted the bottom line.
    • Competitive Pricing Pressure: With the maturation of developed markets, competition from both premium and low-cost manufacturers is intensifying, potentially forcing VATECH to adjust pricing strategies to maintain market share.

    VATECH’s Core Strengths & Long-Term Outlook

    Despite the short-term profit concerns, VATECH’s fundamentals remain robust, supported by several long-term growth drivers. A comprehensive dental imaging investment thesis must weigh these strengths against the current challenges.

    Foundational Pillars of Growth

    • Global Market Penetration: VATECH maintains stable sales in high-value markets like the US and Europe while methodically expanding its footprint in emerging regions, creating a diversified revenue stream.
    • Technological Innovation: The ‘Green X 21’ and the AI collaboration with Pearl are not just new products but strategic moves to capture a higher-margin segment of the market and build a technological moat.
    • Vertical Integration: By producing core sensor technology in-house through its subsidiary Rayence, VATECH gains significant control over its supply chain, enhances cost-competitiveness, and raises barriers to entry for competitors.
    • Financial Stability: A strong balance sheet with high cash reserves provides the company with the resilience to navigate economic downturns and the flexibility to invest in future growth opportunities. You can compare this to our VATECH Q2 2025 analysis for historical context.

    Action Plan for Investors

    Given the mixed signals from the VATECH Q3 2025 earnings, investors should tailor their approach based on their investment horizon.

    Short-Term Perspective

    The market often reacts negatively to earnings misses. It is highly probable that VATECH’s stock will face downward pressure in the immediate future. A cautious, wait-and-see approach is advisable until the company provides more clarity on its margin recovery plan during its official earnings call.

    Mid-to-Long-Term Perspective

    For long-term investors, any potential price dip could represent a buying opportunity, provided the company’s fundamentals remain intact. Key performance indicators to monitor in upcoming quarters include:

    • Sales velocity and market adoption of the ‘Green X 21’ system.
    • Tangible outcomes and revenue synergies from the AI partnership with Pearl.
    • Improvement in operating and net profit margins in Q4 2025 and beyond.
    • Management’s strategy for mitigating currency risks and competitive pressures.

    In conclusion, while the Q3 2025 earnings report introduces short-term uncertainty, VATECH’s strategic initiatives and solid market position suggest its long-term growth story is still valid. Prudent investors will watch closely to see if this quarter’s profitability dip is a temporary anomaly or the beginning of a new trend.

    Disclaimer: This article is for informational purposes only and should not be considered financial advice. Investment decisions should be made based on your own research and judgment.

    (043150) VATECH Q3 2025 Earnings Analysis: Profit Misses Forecasts | Stock Outlook & Investor Guide 관련 이미지
    (043150) VATECH Q3 2025 Earnings Analysis: Profit Misses Forecasts | Stock Outlook & Investor Guide 관련 이미지
  • (052330) KORTEK Q3 2025 Earnings Analysis: A Deep Dive into the Turnaround & Stock Outlook

    (052330) KORTEK Q3 2025 Earnings Analysis: A Deep Dive into the Turnaround & Stock Outlook

    The release of the KORTEK Q3 2025 earnings report on November 6, 2025, has sent significant ripples through the investment community. Display technology specialist KORTEK CORPORATION (KORTEK) unveiled preliminary figures that suggest more than just a solid quarter; they point towards a potential, long-awaited KORTEK turnaround. With notable growth in both revenue and net profit, investors are now closely evaluating whether the company has successfully navigated its recent challenges to forge a new path toward sustainable growth. This comprehensive KORTEK stock analysis will dissect the latest financial data, explore the company’s underlying strengths, and weigh the potential risks to provide a clear outlook for investors.

    Breaking Down the KORTEK Q3 2025 Earnings Report

    KORTEK’s preliminary Q3 results show a marked improvement over a stagnant second quarter, indicating a clear recovery trend. The numbers themselves tell a compelling story of resurgence and operational strength. You can view the complete filing in the Official Disclosure on DART.

    Key Financial Highlights

    • Revenue: Reached KRW 105.6 billion, a significant jump of 11.87% quarter-over-quarter and an impressive 23.79% year-over-year.
    • Operating Profit: Grew to KRW 8.2 billion, marking a 22.39% increase from the previous quarter, though the margin improvement was less pronounced than revenue growth.
    • Net Income: Soared to KRW 5.6 billion. This substantial quarter-over-quarter increase is the strongest signal of a financial turnaround and a significant improvement from the previous year.

    This robust KORTEK financial performance overcomes the lackluster Q2 results (Revenue KRW 94.4B, Operating Profit KRW 6.7B) and establishes a positive momentum heading into the final quarter of the year.

    The Pillars Supporting KORTEK’s Turnaround

    This positive performance isn’t accidental. It’s built on a foundation of market dominance, strategic financial management, and a commitment to shareholders.

    1. Decades of Dominance in Casino Gaming Monitors

    KORTEK’s core business is its global leadership in casino gaming monitors, a position it has held for an astounding 23 consecutive years. This market dominance provides a stable and predictable revenue base. Furthermore, the industry is experiencing powerful tailwinds, including regulatory easing and major integrated resort investments in emerging markets like the UAE, Japan, and Thailand. These developments are poised to directly fuel demand for KORTEK’s primary products, underpinning future growth.

    2. Enhancing Shareholder Value Through Buybacks

    The company’s execution of a KRW 8 billion share buyback program earlier in 2025 sends a powerful message. This move not only provides downside support for the KORTEK stock price but also signals management’s confidence in the company’s intrinsic value and future prospects. Such shareholder-friendly actions are crucial for improving investor sentiment and trust.

    KORTEK’s ability to surge its 2024 operating profit by 391% despite a revenue dip showcases a level of cost management efficiency that is now fueling its 2025 recovery.

    Proceed with Caution: Potential Risks and Headwinds

    Despite the encouraging KORTEK Q3 2025 earnings, prudent investors must consider the potential risks that could impact the company’s trajectory. For a broader view on market risks, expert analysis from platforms like Bloomberg can provide valuable context.

    Global Macroeconomic Volatility

    As a major exporter, KORTEK is highly susceptible to global economic shifts:

    • Exchange Rate Fluctuations: With significant exposure to the USD and EUR, a 10% change in exchange rates can impact pre-tax net income by approximately KRW 9.5 billion. Managing this currency risk is paramount.
    • Interest Rate Sensitivity: A 1% change in interest rates could affect pre-tax net income by KRW 0.2 billion. Shifting monetary policies in the US, Europe, and Korea could influence borrowing costs.

    Internal Business Challenges

    Investors should also monitor the limited improvement in operating profit margin, which could hint at rising costs or competitive pressure. Additionally, the persistent sluggishness in the PID (Public Information Display) business needs to be addressed to ensure healthy diversification and reduce reliance on the core casino segment. For more on this, see our guide to analyzing tech company business segments.

    Frequently Asked Questions (FAQ)

    Q1: What were the key takeaways from KORTEK’s Q3 2025 earnings?

    A1: The main takeaway is the strong signal of a business turnaround. KORTEK reported significant year-over-year revenue growth of 23.79% to KRW 105.6 billion and a substantial quarter-over-quarter jump in net income, indicating a sharp recovery.

    Q2: What is the primary driver of KORTEK’s business?

    A2: KORTEK’s core business is its world-leading casino gaming monitor segment, where it has held the #1 market share for 23 years. Growth is driven by global casino industry expansion and major resort investments.

    Q3: What are the main risks for anyone performing a KORTEK stock analysis?

    A3: The key risks include its high sensitivity to global exchange rate fluctuations, limited growth in operating profit margins relative to revenue, and the underperformance of its secondary PID business segment.

    Q4: What is the overall investment outlook for KORTEK stock?

    A4: The outlook is cautiously optimistic. While the Q3 earnings are very positive, investors should continue to monitor the sustainability of growth, profitability trends, and macroeconomic factors in upcoming quarters before making long-term investment decisions.

    (052330) KORTEK Q3 2025 Earnings Analysis: A Deep Dive into the Turnaround & Stock Outlook 관련 이미지
  • (145720) DENTIUM Q3 2025 IR: A Deep Dive Investment Analysis for Investors

    (145720) DENTIUM Q3 2025 IR: A Deep Dive Investment Analysis for Investors

    The upcoming DENTIUM Q3 2025 IR, scheduled for November 10, 2025, is more than just a financial update; it’s a critical inflection point for the company and its investors. As a leading force in the global dental implant market, DENTIUM is navigating a complex landscape of declining profitability, significant debt, and currency fluctuations. This event will be the leadership’s chance to restore confidence and outline a clear path forward. This comprehensive DENTIUM investment analysis will break down the company’s fundamentals, the key challenges, potential growth catalysts, and the essential questions investors should be asking. This crucial information is based on the company’s official filings. (Official Disclosure)

    A Look Under the Hood: DENTIUM’s Core Fundamentals

    To understand the significance of the upcoming IR, we must first assess DENTIUM’s foundational strengths and weaknesses as of the first half of 2025.

    Market Position and Global Reach

    With a market capitalization of 619.9 billion KRW, DENTIUM is a heavyweight in the dental industry. Its business is built on several key pillars:

    • Core Business Focus: Dental implants are the lifeblood of the company, accounting for 88% of total revenue. This focus is augmented by sales of digital equipment like CBCT scanners (2%) and biomaterials (10%), positioning DENTIUM as a comprehensive ‘Total Solution’ provider.
    • Export-Driven Growth: While holding a strong #2 position in its domestic Korean market (approx. 20% share), the company’s future is global. A staggering 80% of its revenue originates from overseas sales across a network spanning over 70 countries.
    • Chinese Market Powerhouse: DENTIUM has a particularly strong foothold in the Chinese market, a region projected for 20% average annual growth. Its established local network there is a significant competitive advantage. More details can be found in our analysis of trends in the Asian dental market.

    Financial Health Snapshot (H1 2025)

    The DENTIUM financials paint a mixed picture that sets the stage for the Q3 IR:

    • Revenue vs. Profit: Revenue saw modest growth to 159.087 billion KRW, but operating profit fell to 25.124 billion KRW, signaling a troubling decline in profitability.
    • Debt Burden: While the debt-to-equity ratio is a manageable 60.39%, the absolute value of borrowings is high at 265.153 billion KRW. This poses a significant risk of increased financial costs in a rising interest rate environment.
    • Currency Exposure: With significant transactions in USD, EUR, and CNH, DENTIUM is highly exposed to foreign exchange volatility. A mere 10% change in exchange rates could swing profits or losses by over 16 billion KRW.

    Navigating Headwinds: Key Challenges for DENTIUM Stock

    The DENTIUM Q3 2025 IR must directly address the structural issues that have been weighing on investor sentiment and the DENTIUM stock price.

    The core challenge for DENTIUM isn’t its top-line growth, but its ability to convert that revenue into sustainable profit while managing significant financial and currency risks. The Q3 IR is a referendum on management’s strategy to solve this puzzle.

    If the sluggish performance seen in Q2 was due to temporary factors, the market may react positively. However, if the IR reveals deeper, structural problems—such as persistently high raw material costs or increased SG&A expenses from new ventures—the negative impact could be prolonged. The uncertainty around the new Solid Oxide Fuel Cell (SOFC) business, which requires heavy initial investment, further complicates the profitability outlook.

    Charting the Future: DENTIUM’s Growth Engines

    Despite the challenges, DENTIUM has powerful growth levers. The global dental implant market is expanding, driven by aging populations and the rise of digital dentistry. As a major player, DENTIUM is well-positioned to capitalize on this trend. According to market analysis from sources like Bloomberg, this sector shows robust long-term potential.

    Key Points to Watch in the IR Presentation

    • Q3 Performance Metrics: Is there a demonstrable recovery from Q2? The key metric will be sales volume and margin recovery in the Chinese market.
    • Profitability Strategy: Investors need a clear, credible plan to combat declining operating margins. This could include cost-cutting measures, price adjustments, or a shift toward higher-value products.
    • SOFC Business Roadmap: Vague promises are not enough. The company must provide specific timelines, investment details, and realistic profit generation forecasts for this new venture.
    • FX Risk Management: A transparent explanation of the company’s hedging strategies and other measures to mitigate currency risk is non-negotiable.

    Conclusion & Investment Strategy

    The DENTIUM Q3 2025 IR is a pivotal event that will likely dictate the stock’s direction for the coming months. The investment decision hinges on the clarity and credibility of the information presented.

    Positive Scenario (Bull Case): If DENTIUM reports strong Q3 results, particularly from overseas markets, and provides a convincing strategy for margin improvement and risk management, the stock could see significant upward momentum.

    Negative Scenario (Bear Case): If Q3 performance remains weak and management fails to offer clear solutions to the pressing challenges, investor confidence will likely erode, putting downward pressure on the stock price.

    Ultimately, a cautious approach is warranted. Investors should scrutinize the IR announcements, focusing on management’s ability to control costs, navigate global markets, and execute on the promise of its new ventures.

    Frequently Asked Questions (FAQ)

    Q1: What are the main risks for DENTIUM investors?

    The key risks are declining profitability, a high debt load that could become more expensive if interest rates rise, and significant exposure to foreign exchange rate volatility due to its large percentage of overseas sales.

    Q2: What is DENTIUM’s position in the dental implant market?

    DENTIUM is a major global player, holding the #2 market share in South Korea and generating 80% of its revenue from international sales. It is particularly strong in the high-growth Chinese market.

    Q3: What is the SOFC business and why is it important?

    The SOFC (Solid Oxide Fuel Cell) business is DENTIUM’s venture into a new high-tech energy sector to secure future growth. However, it requires significant upfront investment and its path to profitability is a key point of uncertainty that investors will be watching closely during the Q3 2025 IR.

    (145720) DENTIUM Q3 2025 IR: A Deep Dive Investment Analysis for Investors 관련 이미지
  • (455180) KGA CO., LTD (케이지에이) Stock Analysis: Convertible Bond Impact & 2025 Outlook

    (455180) KGA CO., LTD (케이지에이) Stock Analysis: Convertible Bond Impact & 2025 Outlook

    This comprehensive KGA stock analysis provides a deep dive into the recent corporate actions and fundamental health of KGA CO., LTD (케이지에이). With the company’s recent announcement regarding its 1st convertible bond exercise, investors are keenly watching for potential impacts on its stock price and long-term value. This report unpacks the company’s financial status, market environment, and strategic direction to offer clear insights and actionable recommendations for navigating the path ahead.

    The Convertible Bond Exercise: A Closer Look

    On November 5, 2025, KGA CO., LTD announced the issuance of 148,957 new shares resulting from the exercise of convertible bond rights, an event officially filed and available in this Official Disclosure. These new shares represent approximately 1.18% of the company’s market capitalization.

    • New Shares Issued: 148,957 shares
    • Conversion Price: KRW 3,021 per share
    • Expected Listing Date: November 20, 2025

    The immediate effect of this issuance is an increase in the number of outstanding shares, which often leads to a short-term dilution of shareholder value. Furthermore, with the current stock price (KRW 5,220) trading significantly above the conversion price, there is a high probability of profit-taking by bondholders. This could introduce significant selling pressure, potentially driving the stock outlook down in the short term. For a deeper understanding of these financial instruments, you can read our guide on How Convertible Bonds Work.

    Fundamental Analysis: The Bigger Picture for KGA CO., LTD

    Mixed Signals in Corporate Health

    While KGA has benefited from its KOSDAQ listing and recent mergers, which boosted its fundraising capabilities and brand visibility, its recent performance paints a concerning picture. The company is strategically pursuing new growth areas like solid-state batteries and dry electrode processes, but its core business is facing headwinds.

    Positive Developments: The company is building a foundation for future R&D and exploring next-generation battery technologies. It is also actively working to diversify its customer base to reduce dependency on a few key clients.

    Negative Indicators (H1 2025): Revenue plummeted by 40% YoY to KRW 16.542 billion, and operating profit fell nearly 50%. The company swung to a net loss of KRW -5.408 billion, primarily due to merger-related expenses. This decline, coupled with a high debt burden and exposure to foreign exchange risks, raises red flags.

    Financial Indicators Tell a Story of Decline

    A review of KGA’s financial projections reveals a trend of slowing growth and eroding profitability. The operating profit is forecasted to turn negative in 2025, a significant concern for any KGA stock analysis.

    • Revenue Trend: Expected to decline from KRW 1,147.7 billion (2022) to KRW 469.4 billion (2025).
    • Profitability: Operating profit is projected to fall to a deficit of KRW -30.8 billion in 2025.
    • Liquidity Risk: The Current Ratio has alarmingly dropped from 340.96% in 2022 to 58.09% in 2024, indicating potential challenges in meeting short-term obligations.

    Navigating a Turbulent Market Environment

    The global secondary battery market holds long-term promise, but short-term realities are harsh. As noted by industry reports from sources like BloombergNEF, major battery manufacturers are scaling back capital expenditures amidst a temporary slowdown in EV demand. This directly impacts equipment suppliers like KGA. Additionally, macroeconomic factors such as rising KRW/USD and KRW/EUR exchange rates create further financial risk due to the company’s foreign currency-denominated debt.

    Investment Thesis: A Cautious Approach is Advised

    Investment Opinion: “Caution”
    Given the significant fundamental challenges, high debt, and market uncertainties facing KGA CO., LTD, a cautious investment approach is warranted. The short-term pressures from the convertible bond exercise are secondary to these deeper structural issues.

    Key Factors for Investors to Monitor

    For those considering an investment in KGA CO., LTD (케이지에이), the focus should be on long-term viability rather than short-term stock movements. Here are critical areas to watch:

    • New Business Commercialization: Track tangible progress in new ventures like solid-state batteries. Look for specific orders, technological milestones, and a clear timeline for revenue generation.
    • Financial Health Improvement: Monitor efforts to manage the debt-to-equity ratio, hedge against currency risks, and restore positive cash flow from operations.
    • Market Recovery Signals: Pay attention to broader trends in the secondary battery market, including a resumption of capital investment by major players.
    • Future Earnings Guidance: The H2 2025 earnings report and subsequent corporate guidance will be crucial in assessing whether a turnaround is underway.

    In conclusion, a prudent investment strategy for KGA involves patience and careful monitoring. The potential rewards from its next-generation technology initiatives are significant, but they must be weighed against the very real risks present in its current financial and operational state.

    (455180) KGA CO., LTD (케이지에이) Stock Analysis: Convertible Bond Impact & 2025 Outlook 관련 이미지
  • (007340) DN AUTOMOTIVE CORPORATION Earnings (007340): Q3 2025 Analysis & Stock Investment Strategy

    (007340) DN AUTOMOTIVE CORPORATION Earnings (007340): Q3 2025 Analysis & Stock Investment Strategy

    The latest DN AUTOMOTIVE CORPORATION earnings report for Q3 2025 presents a complex picture for investors. The company (007340), a significant player with a diverse portfolio in automotive parts and machine tools, has revealed preliminary figures showing healthy revenue growth juxtaposed with a concerning dip in operating profit. This mixed signal has left the market pondering its next move.

    How should investors interpret these numbers? Is the revenue growth a sign of fundamental strength, or does the profitability decline foreshadow deeper issues? This comprehensive analysis will break down the DN AUTOMOTIVE stock outlook, examining corporate fundamentals, macroeconomic headwinds, and providing a clear investment strategy to help you make informed decisions.

    DN AUTOMOTIVE’s Q3 2025 Preliminary Earnings at a Glance

    On November 5, 2025, DN AUTOMOTIVE CORPORATION released its preliminary consolidated financial results, which can be verified in the company’s Official Disclosure. The key performance indicators paint a nuanced story:

    • Revenue: KRW 918.7 billion. This figure represents a slight but steady year-over-year increase, signaling sustained demand and market presence.
    • Operating Profit: KRW 118.7 billion. The most notable point of concern, this marks a slight decrease quarter-over-quarter, raising questions about margin compression.
    • Net Profit: KRW 66.9 billion. A modest rebound from the previous quarter, but its sustainability is yet to be confirmed.

    While top-line growth is a positive sign of the company’s operational resilience, the decline in operating profit suggests that rising costs or pricing pressures are beginning to eat into profitability.

    The core challenge for DN AUTOMOTIVE is clear: converting strong sales into stronger profits. The divergence between revenue and operating profit is the central theme of this quarter’s results.

    Analysis: The Forces Shaping Performance

    To understand the DN AUTOMOTIVE CORPORATION earnings, we must look beyond the headline numbers and analyze the interplay between internal strategies and external market forces.

    Internal Strategy and Business Structure

    DN AUTOMOTIVE’s strength lies in its diversified business, spanning automotive parts, machine tools, and its emerging battery business. The recent merger with Dong-A Tire & Rubber and the shift to a holding company structure are strategic moves designed to unlock synergies and improve efficiency. However, this diversification also exposes the company to varied segment-specific challenges.

    • Revenue Drivers: Continued investment in new factory expansions and cross-segment sales likely bolstered the top line.
    • Profitability Headwinds: The profit dip could stem from rising raw material costs, increased logistics expenses, or intensified competition in the machine tool market forcing price concessions. For a deeper understanding of how such factors are reported, investors can review guides on reading corporate financial statements.

    The Macroeconomic Gauntlet

    No company operates in a vacuum. Broader economic trends, as reported by outlets like Reuters, are exerting significant pressure:

    • Currency Volatility: A strong USD relative to the KRW increases the cost of imported raw materials and components, directly impacting profit margins.
    • High Interest Rates: Elevated benchmark rates in both Korea and the U.S. increase the cost of capital, making debt servicing more expensive, a notable risk given the company’s high debt-to-asset ratio.
    • Raw Material Costs: While a decline in oil prices provides some relief on transportation costs, the price volatility of specialized materials like rubber remains a key variable.

    Investment Strategy for DN AUTOMOTIVE Stock

    Given this complex environment, a carefully considered investment strategy for DN AUTOMOTIVE is crucial. We recommend a bifurcated approach based on investment horizon.

    Short-Term Outlook: Caution and Patience

    In the immediate term, the market is likely to focus on the negative signal of declining operating profit. This could create downward pressure on the DN AUTOMOTIVE stock price until the company provides clarity. A prudent short-term strategy is a “wait-and-see” approach. Investors should wait for the final, confirmed earnings report and pay close attention to management’s commentary on margin improvement plans.

    Mid- to Long-Term Potential: A Balancing Act

    The long-term picture is more balanced, with clear growth drivers and significant risks.

    • The Bull Case: Growth can be fueled by synergies from the Dong-A merger, the ramp-up of new production facilities, and the company’s diversified revenue streams. Proactive shareholder-friendly policies like dividends and stock buybacks also build investor confidence.
    • The Bear Case: The high debt-to-asset ratio remains a significant vulnerability, especially in a high-interest-rate environment. Continued margin erosion and macroeconomic volatility are the primary risks to monitor.

    Frequently Asked Questions (FAQ)

    What were DN AUTOMOTIVE’s key Q3 2025 results?

    The company reported preliminary revenue of KRW 918.7 billion (an increase), operating profit of KRW 118.7 billion (a decrease), and net profit of KRW 66.9 billion (a slight rebound).

    Why did operating profit fall if revenue grew?

    The decline is likely due to a combination of factors, including rising costs for raw materials and logistics, pricing pressures from competitors, or temporary underperformance in one of its key business segments. The final report will provide more specific details.

    What is the recommended investment approach for 007340 now?

    A conservative, patient approach is advised. Investors should wait for the confirmed earnings release and management’s strategic plans for improving profitability before making significant investment decisions. Continuous monitoring of the company’s debt levels and macroeconomic conditions is essential.

    Disclaimer: This analysis is based on publicly available preliminary information and is intended for informational purposes only. It does not constitute investment advice. All investment decisions are the sole responsibility of the investor.

    (007340) DN AUTOMOTIVE CORPORATION Earnings (007340): Q3 2025 Analysis & Stock Investment Strategy 관련 이미지
  • (100120) Vieworks Q3 2025 Earnings Analysis: A Deep Dive into the Shock & Future Outlook

    (100120) Vieworks Q3 2025 Earnings Analysis: A Deep Dive into the Shock & Future Outlook

    The recent Vieworks Q3 2025 earnings report sent a significant shockwave through the investment community. Vieworks Co., Ltd., a recognized leader in high-performance digital X-ray detectors and industrial imaging solutions, announced preliminary results that fell dramatically short of market consensus. This unexpected downturn has left many investors questioning the company’s immediate trajectory and long-term health.

    This in-depth Vieworks earnings analysis unpacks the critical numbers, diagnoses the underlying causes of the performance slump, and provides a strategic outlook for investors. We will explore whether this is a temporary setback or a sign of deeper structural issues, helping you formulate an informed strategy for your Vieworks stock position.

    The Q3 2025 Earnings Shock by the Numbers

    The preliminary Q3 results revealed a significant disconnect between expectations and reality. According to the Official Disclosure on DART, the key performance indicators were deeply concerning:

    • Revenue: KRW 53.7 billion, missing the forecast of KRW 55.9 billion by 4%.
    • Operating Profit: KRW 4.3 billion, a staggering 31% below the forecast of KRW 6.2 billion.
    • Net Profit: Significantly underperformed against the projected KRW 5.3 billion (final figure undisclosed).

    The 31% miss on operating profit is the most alarming figure. It signals a severe deterioration in profitability that cannot be ignored and has understandably eroded short-term investor confidence.

    Fundamental Diagnosis: What Went Wrong at Vieworks?

    To understand the future, we must first diagnose the past. Our analysis, combining the semi-annual report with these Q3 results, points to a combination of internal and external pressures impacting the company.

    1. Core Business Slowdown & Intensifying Competition

    The engine of Vieworks’ revenue, its medical imaging segment, is sputtering. In the first half of 2025, sales of static imaging digital X-ray detectors fell by 8%, while dental dynamic detectors dropped by over 15%. This slowdown suggests a combination of market saturation and fierce competition from rivals. While the company’s foray into the high-potential digital pathology market is a promising long-term play, it’s not yet mature enough to offset the decline in its core business. For more on this emerging field, you can read about the latest trends in digital pathology.

    2. Declining Financial Health

    The Q3 earnings miss was foreshadowed by a weakening financial position in H1 2025. The company’s debt ratio climbed from 36.36% to 47.33%, and its net debt ratio more than doubled to 23.13%. This increased financial leverage makes the company more vulnerable to profit slumps and rising interest rates. On a positive note, Vieworks is not cutting back on innovation. The company invested a substantial KRW 13 billion in R&D (11.1% of revenue), a necessary gamble to secure future growth engines and maintain its technological edge in industrial imaging solutions and medical devices.

    3. Macroeconomic Pressures and Volatility

    As a global exporter, Vieworks is highly exposed to macroeconomic trends. While a strong US Dollar and Euro can lead to foreign exchange gains, it also increases the cost of imported raw materials, creating a double-edged sword for profitability. According to market analysis from high-authority sources like Bloomberg, global supply chain costs and interest rate policies continue to create an uncertain environment. On the bright side, falling oil prices and shipping costs could provide some relief by stabilizing production and logistics expenses in the coming quarters.

    Investor Playbook: Navigating the Path Forward

    The short-term outlook for Vieworks stock is undoubtedly challenging. The market will be looking for a clear turnaround story. Investors should monitor the following key areas to assess the company’s recovery potential:

    • Q4 Performance Rebound: Is the Q3 slump an anomaly? Watch the Q4 earnings report closely for signs of stabilization or recovery, particularly in the industrial imaging solutions segment, which has shown recent growth.
    • New Business Traction: Look for concrete evidence of market adoption and revenue generation from new ventures, especially the digital pathology system. Tangible results are needed to shift the growth narrative.
    • R&D Monetization: The heavy investment in R&D must translate into profitable new products. Monitor announcements for technological breakthroughs and product launches that can create new revenue streams.
    • Management’s Strategy: Pay close attention to the company’s official communications. Vieworks needs to articulate a clear, convincing plan to address profitability, manage costs, and navigate competition.

    In conclusion, the Vieworks Q3 2025 earnings miss has rightfully put the company under a microscope. While significant challenges in core markets and financial health exist, its commitment to R&D and diversification into new growth areas provides a potential path to recovery. Cautious and diligent monitoring of the key performance areas outlined above will be essential for any investor looking to navigate this period of uncertainty.

    (100120) Vieworks Q3 2025 Earnings Analysis: A Deep Dive into the Shock & Future Outlook 관련 이미지
  • (083650) BHI Co., LTD. Secures ₩70.6B LNG Power Plant Contract: A Deep-Dive Stock Analysis

    (083650) BHI Co., LTD. Secures ₩70.6B LNG Power Plant Contract: A Deep-Dive Stock Analysis

    In a significant development for the global energy sector, leading Korean power plant equipment manufacturer, BHI Co., LTD. (083650), has announced a landmark deal that solidifies its market position. The company has successfully secured a massive ₩70.6 billion contract with Doosan Enerbility for the supply of LNG combined cycle power plant equipment. This agreement, representing a substantial 17.4% of BHI’s recent annual revenue, marks a pivotal moment for the company’s growth trajectory.

    This article provides a comprehensive BHI stock analysis, delving into the specifics of this transformative contract, the company’s underlying fundamentals, and the macroeconomic factors at play. We will explore the opportunities and risks this deal presents, offering valuable insights for investors making informed decisions.

    The Landmark Deal: A Closer Look at the BHI & Doosan Enerbility Partnership

    BHI Co., LTD. has officially entered into an LNG power plant contract with industrial giant Doosan Enerbility. The contract, valued at ₩70.6 billion, is for an overseas supply project and has a duration of approximately three years and four months, spanning from October 31, 2025, to February 28, 2029. This long-term engagement provides BHI with a stable and predictable revenue stream, a crucial factor in the often-volatile project-based industrial sector. The scale of this contract not only boosts the company’s order backlog but also enhances its credibility on the global stage.

    Analyzing BHI’s Fundamentals: Strengths and Headwinds

    A thorough examination of BHI’s fundamentals reveals a company at a crossroads, balancing significant growth opportunities with notable risks that demand careful strategic management.

    Key Opportunities Driving Growth

    • Strategic Business Expansion: BHI’s recent investments in Arete Jaweonhwangyeong Co., Ltd. and Ara Future Power Co., Ltd. signal a clear commitment to expanding its footprint in the power generation sector, securing future growth drivers.
    • Impressive Order Backlog: The company currently holds a robust order backlog of ₩3.2 trillion. This provides a solid foundation for long-term revenue stability and predictable cash flow, reducing dependency on short-term market fluctuations.
    • Anticipated Financial Turnaround: Projections indicate a significant financial improvement, with operating profit and net income expected to turn positive from 2024. Key metrics like net profit margin and Return on Equity (ROE) are forecast to improve markedly in 2025, signaling a return to strong profitability.

    Potential Risk Factors to Monitor

    • Underperforming Subsidiaries: Ongoing losses and impairment charges from subsidiaries like BHI Algeria and EMI Co., Ltd. pose a potential drag on consolidated financial performance.
    • Exposure to Exchange Rate Volatility: With foreign currency assets and liabilities totaling ₩186.5 billion (USD) and ₩74.3 billion (EUR), BHI is highly exposed to currency fluctuations. A 10% change in exchange rates could lead to an ₩11.2 billion swing in profit or loss, making robust FX risk management essential. These figures can be verified in their latest financial disclosures. (Source: Official Disclosure)
    • Inherent Industry Risks: The project-based nature of the energy sector is subject to global market volatility, tightening environmental regulations, and intense competition, all of which can impact future profitability.

    What’s Next? The Ripple Effect of the Contract

    This major contract is poised to create significant positive momentum for BHI, reinforcing its market standing and financial health. It aligns with the global shift towards cleaner energy sources, as noted by the International Energy Agency (IEA), where LNG is seen as a critical transition fuel.

    This partnership with Doosan Enerbility is more than just a contract; it’s a validation of BHI’s technological expertise and a powerful catalyst for future international growth.

    • Fueling Revenue and Profitability: The ₩70.6 billion injection will directly boost top-line revenue and support the projected improvements in operating and net profit margins through 2025.
    • Enhancing Corporate Credibility: Securing a deal with a globally recognized company like Doosan Enerbility serves as a powerful endorsement of BHI’s capabilities, which can be leveraged to win future overseas contracts.
    • Long-Term Operational Stability: The contract’s duration of over three years ensures a stable workload, allowing for better long-term planning and resource allocation.

    Actionable Insights for Savvy Investors

    While this large-scale contract presents a compelling growth story for BHI Co., LTD., astute investors must weigh the optimistic forecast against the inherent risks. Monitoring the company’s progress on several key fronts will be crucial. For those looking to diversify their portfolio, understanding these dynamics is key. Learn more in our guide to investing in the industrial sector.

    Pay close attention to BHI’s ability to execute this contract without significant delays or cost overruns. Furthermore, keep an eye on the company’s quarterly reports for updates on their currency hedging strategies and the financial performance of their international subsidiaries. Successful management in these areas will be the true determinant of long-term value creation.

    (083650) BHI Co., LTD. Secures ₩70.6B LNG Power Plant Contract: A Deep-Dive Stock Analysis 관련 이미지