Tag: financial statement

  • (065710) Seoho Electric Dividend: 4.7% Yield & Analysis of Explosive Growth

    (065710) Seoho Electric Dividend: 4.7% Yield & Analysis of Explosive Growth

    The recent Seoho Electric dividend announcement for Q3 2025 has sent a clear and powerful signal to the market. Declaring a substantial cash dividend that translates to a remarkable 4.7% yield, the company is not only rewarding its investors but also showcasing immense confidence in its financial stability and future growth trajectory. This move has captured the attention of both current and prospective shareholders, prompting a closer look at the fundamentals driving this decision.

    Is this high-yield dividend a sustainable sign of strength, or a one-time event? In this comprehensive analysis, we will explore the core reasons behind this generous shareholder return, from explosive revenue growth and dominance in the port crane control system market to its fortress-like balance sheet. We’ll provide an expert perspective on what this means for the Seoho Electric stock and outline key considerations for investors moving forward.

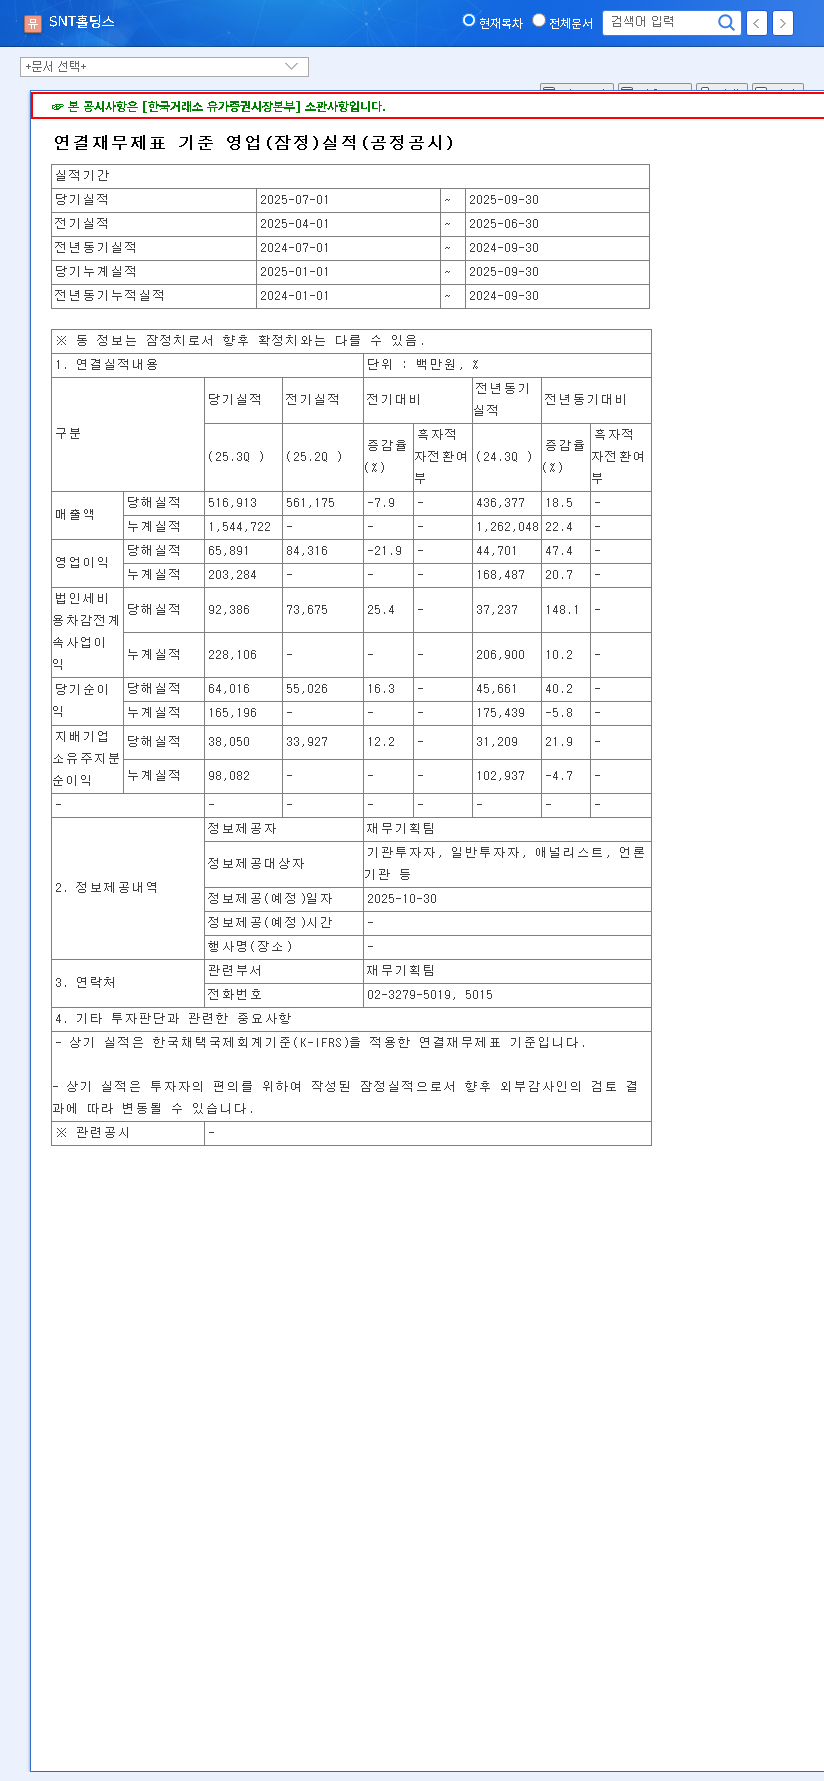
    Seoho Electric Co.,Ltd. has officially declared a cash dividend of 2,000 KRW per common share for the third quarter of 2025. This dividend applies to all shareholders on record as of September 30, 2025, and represents an impressive dividend yield of approximately 4.7% based on the current stock price.

    The Engine Behind the Payout: Analyzing Explosive Growth

    A company doesn’t declare such a significant dividend without the performance to back it up. Seoho Electric’s decision is firmly rooted in a period of unprecedented operational success and financial strength, as highlighted in its Q3 2025 report.

    Record-Breaking Revenue and Profitability

    The company’s top and bottom-line figures are nothing short of stellar. A year-on-year revenue increase of 194.6% demonstrates a massive surge in demand and successful project execution. Even more impressively, operating profit skyrocketed by 480%, indicating incredible operational leverage, pricing power, and cost management. These figures are the foundation upon which strong shareholder returns are built.

    Dominance in the Port Crane Control System Market

    The primary driver of this growth is Seoho Electric’s core business: its advanced port crane control system. Sales in this division grew by an astounding 305.3%, fueled by major overseas projects like the one with PSA Singapore. This isn’t just a temporary spike; a cumulative order backlog of approximately 9.52 billion KRW ensures a stable and predictable revenue stream well into 2027.

    A Fortress Balance Sheet: Financial Health Check

    Robust growth is only valuable if it’s built on a stable financial foundation. Seoho Electric excels here as well, boasting metrics that suggest low risk and high efficiency.

    • Low Leverage: With a debt-to-equity ratio of just 36.45%, the company is minimally reliant on debt and is well-insulated from interest rate volatility.
    • High Capital Efficiency: A Return on Equity (ROE) of 18.5% shows a significant year-on-year improvement, indicating that management is highly effective at using shareholder capital to generate profits.
    • Surging Earnings: Earnings Per Share (EPS) jumped by 124.9% to 3,601 KRW, a direct measure of increased profitability for each share of stock.
    • Strong Cash Flow: A significant increase in operating cash flow proves the company’s ability to generate cash, which is essential for funding operations, growth, and dividends.

    What the Seoho Electric Dividend Means for Investors

    This dividend is more than just a cash payment; it’s a multi-faceted event with significant implications. The decision is a clear vote of confidence from management in the company’s sustained earning power. For a detailed breakdown of the financials, you can view the Official Disclosure, which corroborates this strong outlook.

    Improving Investor Sentiment and Attracting Capital

    A high and well-supported dividend yield can significantly boost a company’s investment appeal. It is likely to improve overall sentiment surrounding the Seoho Electric stock, potentially leading to price appreciation. Furthermore, the 4.7% yield is highly attractive to income-focused investors, which could broaden the shareholder base and increase demand for the stock. Understanding dividend policies is crucial, as we detail in our guide to evaluating dividend stocks.

    Favorable Macroeconomic Tailwinds

    Seoho Electric is also benefiting from powerful global trends. As global supply chains become more complex, the need for efficiency has spurred massive investment in port automation. According to leading industry reports on global logistics, this trend is accelerating, placing companies with proven technology like Seoho Electric in an advantageous position for years to come.

    Investor Action Plan & Key Takeaways

    The Q3 2025 dividend announcement is a profoundly positive signal, underpinned by exceptional growth and a solid financial base. For investors, the key is to monitor whether this becomes a consistent policy.

    • Monitor Dividend Policy: Watch for company statements in future earnings calls regarding the sustainability of its shareholder return program.
    • Track Market Trends: Keep an eye on the growth of the port automation market and any shifts in the competitive landscape.
    • Assess External Factors: Pay attention to how foreign exchange rates (particularly EUR/KRW) and raw material prices impact the company’s profitability.

    (065710) Seoho Electric Dividend: 4.7% Yield & Analysis of Explosive Growth 관련 이미지
    (065710) Seoho Electric Dividend: 4.7% Yield & Analysis of Explosive Growth 관련 이미지
  • (054210) Elentec Exchangeable Bonds: A Deep-Dive Stock Analysis for Investors

    (054210) Elentec Exchangeable Bonds: A Deep-Dive Stock Analysis for Investors

    The latest strategic maneuver from Elentec Co., Ltd involves the issuance of Elentec exchangeable bonds (EB), a decision backed by the disposal of a significant block of its own treasury shares. This move, valued at approximately 4.3 billion KRW, is not just a financial transaction but a clear signal of the company’s ambition to fund new growth avenues. For current and prospective investors, understanding the nuances of this decision is critical to navigating the potential impacts on Elentec’s stock price and long-term value.

    This comprehensive Elentec stock analysis will explore the core reasons behind this fundraising effort, dissect the company’s H1 2025 performance, and evaluate the opportunities and risks that lie ahead. Whether you’re considering a new investment or re-evaluating a current holding, this report provides the detailed outlook you need.

    The Core Deal: Treasury Shares and Exchangeable Bonds

    On November 12, 2025, Elentec formally announced its plan to dispose of 404,329 treasury shares. These shares will serve as the underlying asset for a new issuance of exchangeable bonds. According to the Official Disclosure, the primary goal is to secure strategic capital. This funding is widely expected to be injected into high-potential growth sectors, specifically its E-mobility and Energy Storage System (ESS) battery pack businesses, which are crucial for the company’s future competitiveness.

    By converting treasury stock into liquid capital via exchangeable bonds, Elentec is effectively swapping a passive balance sheet item for active investment fuel. The success of this strategy hinges entirely on the fruitful deployment of these funds into profitable ventures.

    Analyzing Elentec’s H1 2025 Financial Health

    A look at Elentec’s recent performance provides essential context. While the headline numbers show a mixed picture, the underlying details reveal a company in transition. Here are the key takeaways from the H1 2025 financials:

    • Operating Profit Recovery: Despite a 50.4% year-on-year revenue drop to 275.67 billion KRW, Elentec impressively returned to an operating profit of 6.88 billion KRW. This suggests strong cost control and operational efficiency gains.
    • Persistent Net Loss: A net loss of 7.69 billion KRW indicates that challenges remain, and a full turnaround is not yet complete.
    • Segment Weakness: Core revenue streams, including mobile phone cases, battery packs, and e-cigarettes, have experienced a downturn, impacting overall growth.
    • Solid Financial Structure: The company maintains a healthy debt-to-equity ratio of 53.10%, providing a stable foundation for its growth initiatives.
    • Future-Facing Investments: A commitment to R&D, accounting for 3.24% of revenue, highlights the focus on securing long-term technological advantages in emerging markets like E-mobility and ESS technology.

    Potential Impact of Elentec Exchangeable Bonds

    Short-Term Outlook (Neutral to Positive)

    Immediately, the market may react positively to the news of successful fundraising, viewing it as proactive management. However, this could be tempered by the potential for supply overhang from the treasury shares. The specific terms of the Elentec exchangeable bonds—such as coupon rate and exchange price—will be heavily scrutinized and dictate initial sentiment. For context on bond market reactions, resources from high-authority sites like Bloomberg can be valuable.

    Long-Term Outlook (Contingent on Execution)

    The long-term impact is entirely dependent on performance. If the capital is invested wisely and generates tangible returns from the E-mobility and ESS ventures, it will be a significant catalyst for corporate value appreciation. Conversely, if these new businesses fail to gain traction, the company will be left with debt obligations without corresponding growth, potentially pressuring its financials. Furthermore, if bondholders convert their holdings into shares, it could lead to a dilution of value for existing shareholders.

    Comprehensive Investor Outlook & Action Plan

    Given the complexities, investors should adopt a nuanced approach. The decision to issue Elentec exchangeable bonds is a forward-looking move, but near-term hurdles like revenue decline and customer concentration risk cannot be ignored.

    Investment Thesis by Profile

    • Buy (Cautious): For investors with a high-risk tolerance and a long-term horizon. An entry point should be considered only after a thorough analysis of the bond terms and a clear, detailed roadmap from the company on fund allocation.
    • Hold (Active Monitoring): Existing shareholders should closely monitor key performance indicators. Watch for progress in the new business segments, stabilization of core revenue, and any changes in orders from major clients like Samsung Electronics.
    • Sell (Risk Averse): For investors who are uncomfortable with the current uncertainty. The combination of declining revenue, macroeconomic risks, and the execution risk associated with new ventures may justify reallocating capital to more stable assets.

    Key Monitoring Points for All Investors

    • Bond Terms & Market Reaction: The final interest rate, maturity, and conversion price are critical data points.
    • Capital Deployment & ROI: Track quarterly reports for updates on how the raised funds are being used and the initial performance of new projects.
    • Customer Dependency: Any diversification of the customer base away from Samsung Electronics and Samsung SDI would be a major de-risking event.
    • Macroeconomic Headwinds: Keep an eye on global interest rate trends and exchange rate volatility, which directly impact Elentec’s export-driven business model.

    In conclusion, Elentec’s strategic use of treasury shares to fund growth is a bold but necessary step. The ultimate investor outlook will be shaped not by this announcement, but by the successful execution of the company’s vision in the months and years to come.

    (054210) Elentec Exchangeable Bonds: A Deep-Dive Stock Analysis for Investors 관련 이미지
    (054210) Elentec Exchangeable Bonds: A Deep-Dive Stock Analysis for Investors 관련 이미지
  • (272290) INNOX Advanced Materials Q3 2025 Earnings: In-Depth Investment Analysis & Future Outlook

    (272290) INNOX Advanced Materials Q3 2025 Earnings: In-Depth Investment Analysis & Future Outlook

    This comprehensive investment analysis of the INNOX Advanced Materials Q3 2025 earnings report reveals a company at a pivotal crossroads. With its foundational IT materials division providing unwavering stability and its ambitious new secondary battery business poised for explosive growth, INNOX presents a compelling case for investors. This deep dive will dissect the latest financial performance, explore the key drivers behind each business segment, and provide a strategic outlook for those considering a position in this dynamic company.

    INNOX Advanced Materials Q3 2025 Earnings: Key Highlights

    On November 3, 2025, INNOX Advanced Materials Co., Ltd. released its provisional consolidated financials, which largely surpassed market expectations, signaling robust operational health. The official disclosure can be reviewed directly from the source: Official DART Report.

    The Q3 2025 results demonstrated strong top-line and bottom-line performance, with both revenue and net income exceeding analyst consensus. This outperformance underscores the company’s resilience and strategic execution.

    Performance vs. Market Estimates

    • Revenue: KRW 112.7 billion, comfortably exceeding the market estimate of KRW 102.0 billion.
    • Operating Profit: KRW 20.6 billion, perfectly in line with the market estimate of KRW 20.6 billion.
    • Net Income: KRW 17.7 billion, a significant beat over the market estimate of KRW 15.5 billion.

    While operating profit saw a slight decrease from the previous quarter, likely due to strategic reinvestments, the strong net income figure is a highly positive signal for investors, indicating efficient management and financial health.

    The Bedrock: Stable IT Materials Division

    The core of INNOX Advanced Materials‘ current success is its IT materials division. This segment is a consistent generator of revenue and profit, thanks to its high-tech product portfolio and established market position.

    Key Contributors to IT Stability

    • OLED Materials: As a dominant revenue source, these materials are crucial for the production of next-generation displays in smartphones, tablets, and televisions.
    • Semiconductor PKG Materials: The company’s push for localization and expansion in the advanced packaging market is creating new avenues for growth, aligning with global trends in chip manufacturing. For more context, you can read our deep dive into the semiconductor industry.

    The Future: Igniting the Secondary Battery Growth Engine

    The most exciting element of the INNOX story is its strategic entry into the secondary battery materials business. This move is designed to capture a share of the rapidly expanding electric vehicle (EV) market and transform the company’s long-term growth trajectory. The planned operation of its first lithium hydroxide line in H1 2026 marks a critical milestone toward commercialization.

    Strategic Investment vs. Short-Term Profitability

    Embarking on such a large-scale venture naturally involves significant upfront costs. Increased capital expenditure, R&D, and operational expenses for the new battery division may temporarily suppress operating profit and key metrics like ROE (Return on Equity) and EPS (Earnings Per Share). However, this is a calculated investment in a high-growth sector. As experts predict for the global EV battery market, the potential rewards for established suppliers of critical materials like lithium hydroxide are immense.

    Financial Health and Risk Management

    A thorough investment analysis must also consider financial resilience and external risks. INNOX Advanced Materials demonstrates a strong foundation in this regard.

    Solid Financial Footing

    With a consolidated debt-to-equity ratio of 77.02%, the company maintains a healthy balance sheet. This provides the financial flexibility needed to fund its expansion into the battery sector without over-leveraging. The consistent growth in total equity, even with the major investment in INNOX Lithium Co., Ltd., is a testament to its sound financial management.

    Navigating Macroeconomic Headwinds

    Like any global manufacturer, INNOX is exposed to macroeconomic variables. Key factors to monitor include currency exchange rate fluctuations, rising interest rates that could increase borrowing costs, and volatile raw material and logistics prices. The company’s ability to manage these external pressures will be critical to sustaining profitability.

    Investment Outlook and Strategic Recommendations

    The INNOX Advanced Materials Q3 2025 earnings confirm a positive trajectory. The stock’s performance since H2 2024 reflects growing investor optimism about the battery business. The better-than-expected net income in Q3 could provide further short-term momentum.

    A Long-Term Investment Strategy

    • Focus on the Horizon: Value will be driven by the successful execution of the secondary battery strategy. Investors should look beyond short-term profit dips and focus on long-term milestones.
    • Monitor Key Milestones: Track the progress of the INNOX Lithium factory construction, mass production timelines, customer acquisition announcements, and lithium price trends.
    • Evaluate Risk Management: Assess the company’s ongoing financial health and its proactive strategies for managing macroeconomic risks like interest rate changes and currency volatility.

    In conclusion, INNOX Advanced Materials is successfully balancing the profitability of its present with aggressive investment in its future. While execution risks in the competitive battery market remain, the company’s strong foundation and clear strategic vision make it a compelling name to watch for long-term growth investors.

    (272290) INNOX Advanced Materials Q3 2025 Earnings: In-Depth Investment Analysis & Future Outlook 관련 이미지
  • (499790) GS P&L Co., Ltd. (499790) Earnings Shock: Deep Dive Analysis & 2025 Stock Forecast

    (499790) GS P&L Co., Ltd. (499790) Earnings Shock: Deep Dive Analysis & 2025 Stock Forecast

    The latest preliminary earnings release from GS P&L Co., Ltd. (499790) for the third quarter of 2025 has sent a wave of concern through the investment community. While the company posted a marginal increase in revenue, a severe and unexpected decline in profitability has triggered an ‘earnings shock’, raising critical questions about its operational health and future stock performance. This comprehensive analysis will dissect the Q3 results, explore the underlying causes of the profit slump, and provide a strategic outlook for investors navigating this period of uncertainty.

    Despite revenue slightly beating forecasts, GS P&L’s operating profit missed estimates by over 20%, and net profit plummeted by a staggering 52%. This disconnect between top-line growth and bottom-line results is the central issue facing investors today.

    Deconstructing the Q3 2025 Earnings Report

    On the surface, the revenue figures for GS P&L Co., Ltd. (499790) were not a cause for alarm. The company reported revenue of KRW 122 billion, a 1.07% beat over the market consensus of KRW 120.7 billion. However, the story completely changes as we move down the income statement. The official figures, as detailed in the company’s filing (Official Disclosure), paint a much darker picture of profitability.

    • Operating Profit: Came in at KRW 19.9 billion, a substantial 20.95% miss compared to the estimated KRW 25.2 billion.
    • Net Profit: Plummeted to just KRW 8.4 billion, falling an alarming 52.27% short of the KRW 17.6 billion consensus estimate.

    This severe erosion of profit margins has understandably overshadowed the modest revenue growth, leading to a significant downturn in investor sentiment and questions about the company’s core operational efficiency.

    What Drove the Profit Plunge? A Two-Front Analysis

    The disappointing GS P&L earnings were not the result of a single issue, but rather a confluence of internal challenges and external economic pressures.

    Internal Headwinds: Renovation Costs and Operational Lags

    Internally, several factors contributed to the margin compression. While profits improved from a weak Q2, they failed to recapture the high levels of efficiency seen in Q1. One of the most significant drains on profitability appears to be the ongoing renovation of The Westin Seoul Parnas. Large-scale capital expenditures of this nature often lead to direct costs and operational disruptions that squeeze profits in the short term. Furthermore, the company’s heavy reliance on its subsidiary, Parnas Hotel Co., Ltd., means any operational setbacks within that single unit can disproportionately affect the entire group’s financial health. The sharp drop in net profit also suggests an increase in non-operating expenses, such as higher financing costs or other one-off charges.

    External Pressures: Macroeconomic Storm Clouds

    The broader economic environment has created a challenging landscape for the hotel and leisure industry. Persistent inflation and high interest rates, while stabilizing, have likely dampened discretionary consumer spending. This aligns with recent global economic forecasts from sources like leading financial news outlets. Even as international tourism recovers, the average spend per visitor may be constrained. Additionally, currency fluctuations, particularly the strong KRW/USD exchange rate, could have inflated import costs for supplies and materials, further pressuring margins. While stable oil prices offered some relief on the cost side, it wasn’t enough to offset the broader negative macroeconomic trends.

    Future Outlook for GS P&L Stock (499790)

    Short-Term Volatility and Market Sentiment

    In the immediate term, the GS P&L stock is likely to face significant downward pressure. A profit miss of this magnitude will almost certainly lead to estimate revisions from analysts and a contraction in investor sentiment. The stock, which has already shown high volatility since its 2024 listing, may see its recent sideways trend broken as the market digests this negative news.

    Long-Term Growth Catalysts and Potential Risks

    Looking ahead, the long-term trajectory of 499790 stock analysis depends on several key factors:

    • Growth Catalysts: The successful completion of the Westin Seoul Parnas renovation could become a major driver of future revenue and profitability. A sustained recovery in global travel and an improvement in consumer sentiment are also critical. For a deeper dive into the sector, see our comprehensive analysis of 2025 hotel industry trends.
    • Potential Risks: A prolonged economic downturn remains the primary threat. Additionally, investors must monitor the company’s ability to manage its high debt ratio and efficiently control rising operating expenses to restore profitability.

    Strategic Action Plan for Investors

    Given the significant uncertainty, a cautious and measured approach is recommended. Hasty decisions based on a single quarter’s performance can often be detrimental.

    • Hold & Monitor: For current shareholders, panic selling may not be the best course. It is advisable to hold and closely monitor the Q4 earnings report and management’s forward-looking guidance for signs of a turnaround.
    • Strengthen Risk Management: Pay close attention to the company’s balance sheet, particularly its debt levels and interest coverage ratio. The company’s ability to navigate a high-interest environment is key.
    • Wait for Clarity: Potential investors should remain on the sidelines until there is more clarity. A positive Q4 report or clear evidence that renovation costs are subsiding would be a much stronger entry signal.

    This analysis is based on preliminary data and market conditions. All investment decisions should be made based on individual research and risk tolerance.

    (499790) GS P&L Co., Ltd. (499790) Earnings Shock: Deep Dive Analysis & 2025 Stock Forecast 관련 이미지
  • (204320) HL Mando Q3 2025 Earnings: In-Depth Financial Analysis & Investor Outlook

    (204320) HL Mando Q3 2025 Earnings: In-Depth Financial Analysis & Investor Outlook

    The latest HL Mando Q3 2025 earnings report presents a complex picture for investors. As a pivotal player in the global automotive components industry, HL Mando (KRX: 204320) delivered a set of preliminary results that beat expectations on one hand while raising significant concerns on the other. While operating profit demonstrated resilience, a stark miss in net income has left the market seeking clarity.

    This comprehensive HL Mando financial analysis will dissect the Q3 2025 numbers, explore the underlying operational strengths and market headwinds, and provide a strategic outlook for current and potential investors in HL Mando stock.

    HL Mando’s Q3 2025 Earnings: The Official Numbers

    HL Mando officially announced its preliminary Q3 2025 results, which can be viewed in the Official Disclosure (DART). Here is a summary of the key figures compared to market consensus:

    • Revenue: KRW 2,321.3 billion, missing the estimate of KRW 2,385.5 billion by a narrow margin of 2.88%.
    • Operating Profit: KRW 94.2 billion, slightly exceeding the estimate of KRW 92.8 billion by 1.51%, indicating solid operational control.
    • Net Income: KRW 43.7 billion, a significant miss of 29.24% against the estimate of KRW 61.9 billion, becoming the primary point of concern.

    While the year-on-year performance showed growth, the quarter-on-quarter figures revealed a slight decline in revenue and operating profit. The significant miss on the bottom line suggests that non-operating factors or one-time costs played a crucial role this quarter.

    The core challenge for investors is to look past the headline numbers of the Q3 2025 earnings and understand the divergence between operational efficiency and net profitability. This requires a deeper look at both internal fundamentals and external market pressures.

    Unpacking the Discrepancy: A Deeper Financial Analysis

    The divergence between a strong operating profit and a weak net income is a classic signal for investors to dig deeper. The operating profit beat, however slight, points to effective cost management and resilient core business operations. However, the net income shortfall could stem from several factors below the operating line, such as higher interest expenses on debt, foreign exchange losses, or increased tax liabilities.

    Core Strengths Supporting Long-Term Growth

    Despite short-term volatility, HL Mando’s fundamental strengths provide a solid foundation. These are key pillars of the long-term investor outlook:

    • Global Customer Diversification: With major clients like GM, Ford, and various Chinese OEMs, HL Mando is not overly reliant on a single market, which adds a layer of stability against regional economic downturns.
    • Leadership in Future Mobility: Significant investment in Advanced Driver-Assistance Systems (ADAS) and electrification components positions the company at the forefront of the automotive industry’s biggest trends. For more on this sector, see our deep dive into the global ADAS market.
    • Supply Chain Vertical Integration: By internalizing key technologies like motor production through acquisitions, the company enhances its supply chain resilience and cost control.

    Market Headwinds and Risks to Monitor

    Investors must balance these strengths against prevailing market risks that are impacting the entire automotive components stock sector. According to market analysis from sources like Bloomberg, the global auto industry faces a period of adjustment.

    • Slowing EV Demand: A deceleration in the growth rate of electric vehicle sales, particularly in North America and Europe, could temper revenue forecasts for component suppliers.
    • Macroeconomic Uncertainty: Persistent high-interest rates and geopolitical tensions continue to suppress consumer demand and create volatility in key markets.
    • Currency Fluctuations: As a major exporter, HL Mando’s profitability is directly exposed to the volatility of the Korean Won against the US Dollar and Euro.

    Investor Action Plan & Future Outlook

    Given the mixed signals from the HL Mando Q3 2025 earnings, a prudent investment strategy is required. While the net income miss may create short-term selling pressure on HL Mando stock, the company’s long-term growth narrative in future mobility remains intact.

    Key actions for investors include:

    1. 1. Scrutinize the Full Report: Wait for the comprehensive earnings report to fully understand the specific one-off costs or non-operating items that impacted net income.
    2. 2. Monitor ADAS & EV Order Book: Keep a close eye on company announcements regarding new contracts and order pipelines for their high-tech components, as this is the primary driver for future growth.
    3. 3. Assess Global Auto Sales Data: Track monthly and quarterly sales figures from major automotive markets to gauge the health of the overall industry and its impact on component demand.

    Frequently Asked Questions (FAQ)

    What were HL Mando’s key Q3 2025 results?

    HL Mando reported Q3 2025 revenue of KRW 2,321.3B, operating profit of KRW 94.2B, and net income of KRW 43.7B. Revenue slightly missed estimates, operating profit beat slightly, and net income significantly underperformed expectations.

    What are HL Mando’s primary long-term growth drivers?

    The company’s long-term growth is anchored in its technological leadership in ADAS (Advanced Driver-Assistance Systems) and components for electric vehicles. Its diversified global customer base also provides a stable foundation for expansion.

    What should investors watch for in the coming months?

    Investors should focus on the detailed explanation for the net income miss in the full report, the pace of recovery in global auto markets, and the company’s ability to secure new high-value contracts in the EV and ADAS segments.

    (204320) HL Mando Q3 2025 Earnings: In-Depth Financial Analysis & Investor Outlook 관련 이미지
  • (036530) SNT Holdings Earnings (036530) Q3 2025: A Deep Dive into Profitability and Future Growth

    (036530) SNT Holdings Earnings (036530) Q3 2025: A Deep Dive into Profitability and Future Growth

    The latest SNT Holdings earnings report for Q3 2025 has presented a complex and challenging picture for investors. While the company posted a commendable increase in overall revenue, a noticeable decline in operating profit and net income has raised questions about its short-term trajectory. Is this a temporary dip or a sign of deeper structural issues? This comprehensive SNT Holdings stock analysis will dissect the Q3 performance, explore the underlying causes, and provide a clear outlook for potential investors.

    By examining the pressures on its core divisions alongside the success of its diversification strategy, we can gain the insights needed to understand SNT Holdings’ current standing and make informed decisions for the future.

    Decoding the SNT Holdings Q3 2025 Earnings Report

    According to the company’s preliminary announcement, SNT Holdings (036530) reported consolidated revenues of KRW 516.9 billion, a solid year-over-year increase. However, the profitability metrics tell a different story. Operating profit fell to KRW 65.9 billion, and net income dropped to KRW 38.0 billion. This decline, especially when compared to the strong performance in Q2, has understandably tempered market optimism. For a detailed breakdown, you can review the Official Disclosure (DART).

    The Core Challenge: Profitability Pressure in Vehicle Parts

    The primary driver behind the disappointing profit figures is the deteriorating SNT Holdings profitability within its crucial Vehicle Parts division. This isn’t an entirely new development; signs of pressure were already visible in the H1 2025 report. In Q3, these challenges likely intensified due to a confluence of factors:

    • Raw Material Costs: Volatility in the prices of steel, aluminum, and other key industrial commodities continues to squeeze margins.
    • Exchange Rate Fluctuations: As a major exporter, the volatility in the KRW/USD and KRW/EUR exchange rates directly impacts the company’s bottom line.
    • Intensified Competition: The global automotive market is fiercely competitive. The structural shift towards electric and eco-friendly vehicles demands significant R&D investment, further pressuring profitability in the short term. For more on this trend, see this global auto market report from Reuters.

    The pressure on the automotive sector reveals both a short-term challenge and a long-term strategic imperative for SNT Holdings: diversification is no longer a choice, but the key to survival and growth.

    Bright Spots: Diversification Strategy is Paying Off

    Despite the headwinds in the auto sector, the latest SNT Holdings earnings report highlights the success of its business diversification. Two divisions, in particular, provided a crucial counterbalance:

    Industrial Equipment & Defense Divisions

    The Industrial Equipment division demonstrated robust growth, largely fueled by expanding orders for LNG plant construction projects across the Middle East and the Americas. This reflects a strong global demand for energy infrastructure. Simultaneously, the Defense division maintained its stable, high-margin performance, bolstered by the deployment of new weapon systems and a successful push for overseas exports. These successes prove that SNT Holdings is not a one-trick pony and its multi-faceted business model provides a valuable hedge against cyclical downturns in any single industry.

    Financial Health: A Solid Foundation

    Beneath the surface of the quarterly performance, SNT Holdings maintains excellent financial health. As of the first half of 2025, its debt-to-equity ratio stood at a very low 35.11%. This indicates the company is not over-leveraged and has a strong capacity to weather economic storms. You can learn more about what this means in our guide to analyzing financial statements. Furthermore, an increase in cash reserves and proactive measures like issuing exchangeable bonds demonstrate a commitment to maintaining financial flexibility, which is crucial for funding ongoing R&D and future growth initiatives.

    Investor Outlook: Short-Term Caution, Long-Term Opportunity

    The market’s reaction to the Q3 SNT Holdings earnings may be negative in the short term. The halt in the trend of improving profitability is a valid concern. However, a mid-to-long-term perspective reveals a more nuanced picture.

    Investment Strategy Summary

    Based on this SNT Holdings stock analysis, here are our strategic considerations:

    • Hold: For existing investors, it is prudent to observe the next few quarters. Watch for signs that the profitability issues in the Vehicle Parts division are being effectively managed.
    • Consider Buying: New positions could be initiated if there is a clear stabilization in exchange rates and raw material prices, coupled with a demonstrable recovery in the auto division’s operating margins.
    • Consider Selling: If the auto division’s profitability continues to erode without a corresponding acceleration of growth in other segments, it may be a sign of deeper fundamental weakness that warrants a re-evaluation of the investment.

    In conclusion, while SNT Holdings faces immediate challenges, its diversified portfolio, strong financial footing, and potential in future growth sectors like eco-friendly vehicle components and defense present a compelling long-term case. Careful monitoring of key performance indicators will be essential in navigating the path forward.

    Disclaimer: This report is based on publicly available information. Investment decisions should be made based on the investor’s own judgment and responsibility.

    (036530) SNT Holdings Earnings (036530) Q3 2025: A Deep Dive into Profitability and Future Growth 관련 이미지
  • Samyang Comtech (484590) Post-IPO Stock Analysis: Will Defense Sector Growth Propel its Rise?

    1. What Happened with Samyang Comtech?

    Samyang Comtech successfully debuted on the KOSDAQ market on August 18, 2025. However, the stock price has declined since its listing, causing concern for investors. While Q2 2025 earnings showed significant growth with revenue of KRW 35.4 billion and operating profit of KRW 7.8 billion compared to the previous quarter, the post-IPO stock performance has fallen short of expectations.

    2. Why Did This Happen?

    The stock price decline is attributed to multiple factors. Initial profit-taking after the IPO, market revaluation, and concerns about past financial statement revisions likely contributed to the decline. The decrease in R&D investment raises questions about the company’s long-term growth prospects. However, the robust growth in the defense sector and the order backlog of KRW 216 billion could be positive factors.

    3. What’s the Outlook?

    Samyang Comtech’s future stock performance hinges on continued orders and earnings growth in the defense sector. While increasing global geopolitical instability creates a favorable environment for defense companies, macroeconomic uncertainties remain. Investors should closely monitor changes in the company’s fundamentals and market conditions.

    4. What Actions Should Investors Take?

    • Monitor Key Indicators: Continuously track defense sector orders and earnings, financial statement transparency, and changes in R&D investment.
    • Consider Macroeconomic Factors: Analyze the impact of changes in interest rates, exchange rates, and geopolitical risks on the company’s performance.
    • Diversify Investments: Consider a diversified investment strategy to mitigate investment risks.
    Q: What is Samyang Comtech’s main business?

    A: Samyang Comtech focuses on the defense sector (K2 tank, small tactical vehicles, etc., defense parts) and plans to use the funds raised through the IPO for business expansion.

    Q: What are the key considerations when investing in Samyang Comtech?

    A: Investors should carefully consider past financial statement revisions, decreased R&D investment, and post-IPO stock volatility.

    Q: What is the outlook for Samyang Comtech?

    A: While the growth potential in the defense sector is high, investment decisions should be made considering macroeconomic uncertainties and changes in the competitive landscape.

  • VOneTech H1 2025 Earnings Report Analysis: A Turnaround with AI?

    1. VOneTech H1 2025 Performance: What Happened?

    VOneTech reported KRW 13.4 billion in revenue, KRW -3.6 billion in operating income, and KRW -4.3 billion in net income for H1 2025, reflecting weak performance. The downward trend in sales, observed since Q3 2024, continued, with operating income turning negative.

    2. Reasons for Decline: Why These Results?

    The primary driver behind VOneTech’s underperformance is the sales decline across key business segments, including display, secondary batteries, and robotics. External factors such as a maturing LCD market, intensified competition in OLEDs, and a slowdown in the secondary battery investment cycle contributed to this decline. Increased R&D spending also impacted profitability.

    • Display: Revenue share decreased by 11.4% due to a sluggish LCD market and intensified OLED competition.
    • Secondary Batteries: Despite market growth, revenue share fell by 27.1% due to heightened competition and the impact of the investment cycle.
    • Robotics: While the AMR/AGV market is growing, VOneTech faces challenges in profitability due to intensifying competition, despite robotics being their largest segment at 49.7% of revenue.

    3. Future Growth Potential: What Lies Ahead?

    Despite the short-term setbacks, VOneTech’s future growth prospects remain promising. The AI-powered ‘With AI’ platform is anticipated to be a key growth driver, creating synergies with existing business segments. The continued growth of the robotics segment and long-term potential of the secondary battery market are also positive indicators.

    4. Action Plan for Investors: What Should You Do?

    Investors should focus on the long-term growth potential rather than short-term results. Closely monitor the commercialization and market reception of the ‘With AI’ platform, the growth trajectory of the robotics business, and improvements in profitability. Managing exchange rate volatility and key customer acquisition strategies should also be carefully considered.

    Q. How did VOneTech perform in H1 2025?

    A. VOneTech reported KRW 13.4 billion in revenue, KRW -3.6 billion in operating income, and KRW -4.3 billion in net income, showing a decline in sales and a shift into operating losses compared to the same period last year.

    Q. What are the reasons for VOneTech’s poor performance?

    A. The decline in sales across key business segments like display, secondary batteries, and robotics, coupled with increased R&D expenditure impacting operating expenses, are the main contributors. External market conditions also played a role.

    Q. What are the future growth prospects for VOneTech?

    A. The launch of the ‘With AI’ platform is expected to drive future growth by creating synergies with existing businesses. The growth in robotics and the long-term potential of the secondary battery market are also positive signs.

    Q. What should investors focus on?

    A. Investors should monitor the commercialization and market reception of ‘With AI’, the growth of robotics, profitability improvements, exchange rate volatility management, and key customer acquisition strategies.

  • WEIVERS (336060) H1 2025 Earnings Analysis: Revenue Growth, but Profitability Concerns – Investment Strategy?

    1. WEIVERS H1 2025 Performance: What Happened?

    WEIVERS reported KRW 17.1 billion in revenue for H1 2025, exceeding expectations. However, the company recorded an operating loss of KRW 500 million and a net loss of KRW 200 million. Increased cost of sales and operating expenses are cited as the primary drivers of the decline in profitability.

    2. Why These Results? Understanding the Factors

    • Positive Factors: Growth in the geospatial information market, government support for digital twin initiatives, acquisition of Naver System’s GIS division, competitive edge in proprietary solutions, and a robust order backlog exceeding KRW 55.6 billion.
    • Cautionary Factors: Negative operating and net income based on consolidated financial statements and a decrease in operating cash flow.

    3. WEIVERS Outlook: What’s Next?

    WEIVERS possesses long-term growth potential fueled by the expanding geospatial information and digital twin markets and supportive government policies. However, the short-term decline in profitability poses investment risks. Close monitoring of future earnings improvements, tangible results from new business ventures, and macroeconomic conditions is crucial.

    4. Investor Action Plan: What Should You Do?

    The current investment recommendation is “Hold.” Investors should carefully consider future earnings announcements, business developments, and macroeconomic shifts before making investment decisions.

    WEIVERS Investment FAQ

    What is WEIVERS’ core business?

    WEIVERS provides various solutions based on geospatial information and digital twin technology.

    How did WEIVERS perform in H1 2025?

    While revenue exceeded expectations at KRW 17.1 billion, both operating and net income were negative.

    What should investors be cautious of when considering WEIVERS?

    Investors should be mindful of short-term profitability concerns and macroeconomic fluctuations.

  • Rsupport’s H1 2025 Earnings: Profitability Improves Despite Revenue Decline, AI Powers Future Growth

    1. Rsupport’s H1 2025 Performance: What Happened?

    Rsupport recorded consolidated revenue of KRW 26.777 billion (a 43.5% YoY decrease) and operating profit of KRW 4.585 billion (a 24.7% YoY increase) in the first half of 2025. While revenue declined, the significant improvement in operating profit, demonstrating increased profitability, is a key takeaway.

    2. Why These Results?

    The primary cause of the revenue decline is attributed to the economic downturn and the subsequent contraction in IT investment. However, Rsupport improved profitability through cost management efficiencies and a strategic focus on high-value-added services. The stable performance of core businesses like ‘RemoteCall’ and ‘RemoteView’ is particularly positive. Furthermore, R&D investment, amounting to 21.69% of revenue, has led to the launch of new AI-powered service ‘Airepoto’ and video conferencing product ‘RFICE,’ securing future growth engines.

    3. What’s Next?

    Rsupport is expected to continue its growth trajectory, supported by its robust fundamentals. The solid growth of its Japanese subsidiary, coupled with the global launch of new AI services, is projected to provide new growth momentum. A low debt-to-equity ratio (14.64%) ensures a stable financial structure even amidst external risks like interest rate fluctuations.

    4. Investor Action Plan

    Rsupport is a company where investors should focus on long-term growth potential rather than short-term revenue fluctuations. Investors should closely monitor continued R&D achievements, market response to new AI services, and exchange rate/interest rate trends to inform their investment decisions. The company’s performance in the global market, particularly in Japan, and its ability to secure competitiveness in AI services will be crucial factors determining future stock price direction.

    What were Rsupport’s revenue and operating profit for H1 2025?

    Rsupport’s consolidated revenue for H1 2025 was KRW 26.777 billion, and operating profit was KRW 4.585 billion.

    What are Rsupport’s main businesses?

    Rsupport’s main businesses are remote support solution ‘RemoteCall’ and remote control solution ‘RemoteView.’ They recently launched AI-powered service ‘Airepoto’ and video conferencing product ‘RFICE.’

    What are the key investment points for Rsupport?

    Key investment points for Rsupport include improved profitability, launch of new AI-powered services, global market expansion including the Japanese market, and a low debt-to-equity ratio.