Tag: Earnings Surprise

  • (029780) Samsung Card (029780) Q3 2025 Earnings Analysis: Profit Beats Forecasts – Is the Stock a Buy?

    (029780) Samsung Card (029780) Q3 2025 Earnings Analysis: Profit Beats Forecasts – Is the Stock a Buy?

    The latest SAMSUNG CARD CO.,LTD Q3 2025 earnings report has presented investors with a complex but intriguing picture. Amidst a challenging global economic climate, the company reported a surprising profit beat despite falling short on revenue forecasts. This mix of results raises a critical question for holders of Samsung Card stock (ticker: 029780): Does this performance signal underlying strength and resilience, or is it a temporary anomaly in a volatile market? This comprehensive Samsung Card analysis will dissect the numbers, explore the strategies behind the results, and provide a clear outlook on what investors should consider next.

    📈 Dissecting the SAMSUNG CARD CO.,LTD Q3 2025 Earnings Report

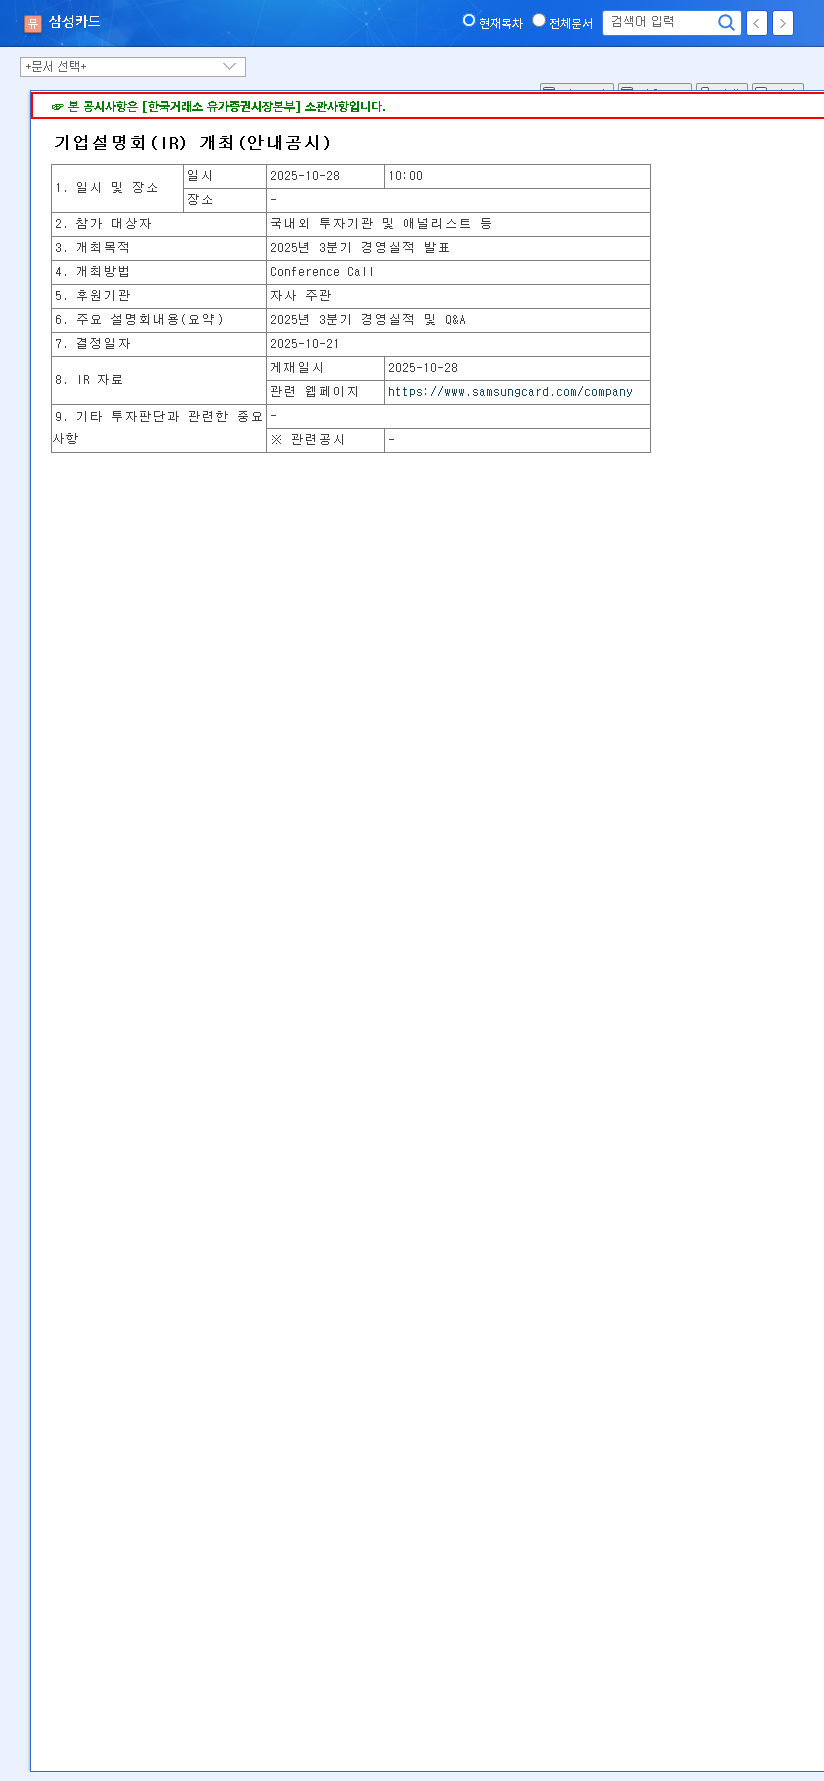
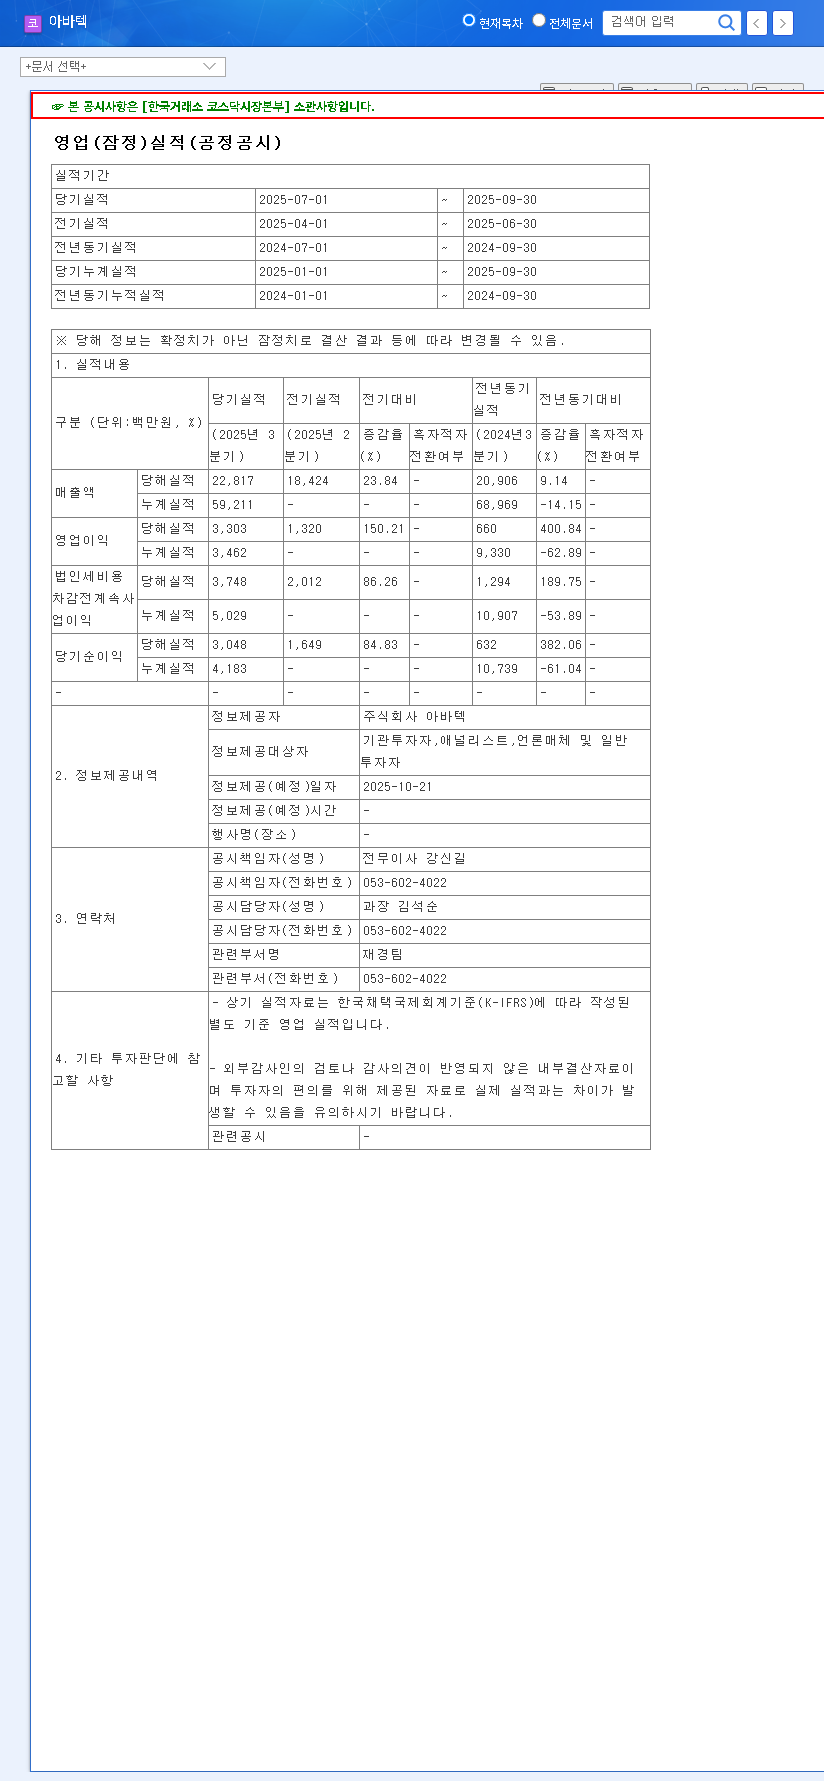
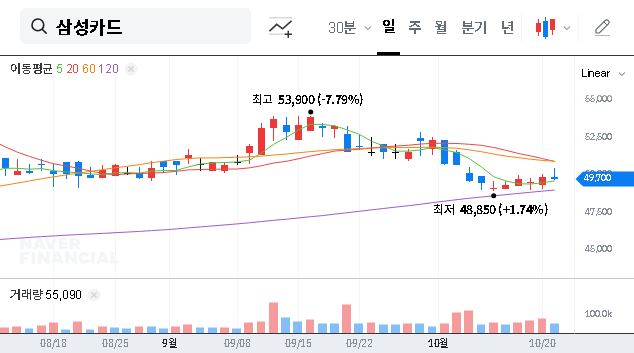
    To truly understand the story, we need to look beyond the headlines and examine the figures in detail. Samsung Card’s performance reveals a strategic focus on profitability over pure top-line growth. The official figures, as reported in the company’s disclosure, paint a clear picture. You can view the complete filing here: Official Disclosure (DART).

    Here’s a breakdown of the actual results versus the market consensus:

    • Revenue: KRW 1,007.8 billion, missing the forecast of KRW 1,077.7 billion by a notable -6.5%.
    • Operating Profit: KRW 213.6 billion, beating the forecast of KRW 207.1 billion by +3.1%.
    • Net Income: KRW 161.7 billion, comfortably exceeding the forecast of KRW 153.9 billion by +5.1%.

    The key takeaway is the impressive ‘earnings surprise’ in both operating profit and net income. This suggests that while revenue generation faced headwinds—potentially from softening consumer sentiment or seasonal factors—the company’s core operations are highly efficient and its management has excelled at controlling costs and optimizing its asset portfolio.

    🔍 The Pillars of Samsung Card’s Profitability

    How did Samsung Card achieve this robust profitability in a tough environment? The answer lies in a combination of strong fundamentals, strategic initiatives, and prudent financial management.

    Robust Fundamentals and Financial Health

    At its core, Samsung Card is built on a stable foundation. A massive base of 13.36 million members and 3.03 million merchants provides a consistent revenue stream. This is supported by exceptional financial soundness, as evidenced by its H1 2025 report: an adjusted equity ratio of 30.55% (well above the 8% minimum), low delinquency rates, and a strong liquidity ratio of 602.77%. This financial stability is affirmed by its ‘AA+’ credit rating, which ensures access to favorable funding.

    Strategic Digital Transformation

    Samsung Card isn’t standing still. The company is actively enhancing its competitive edge through digital transformation. The introduction of ‘Sam’, an AI-powered chatbot, and a 24-hour automated card issuance system are not just buzzworthy projects; they are concrete steps to improve customer satisfaction and operational efficiency, directly impacting the bottom line.

    Samsung Card’s Q3 2025 performance is a textbook example of operational excellence, demonstrating that in a challenging market, superior profitability management can be more impactful than headline revenue growth.

    Investment Outlook for Samsung Card Stock (029780)

    Given the 029780 earnings results, investors need to weigh the positive signals against potential risks on the horizon.

    Positive Factors to Consider

    • Proven Profitability: The ability to deliver an earnings surprise demonstrates strong management and cost control, which can boost investor confidence in the short term.
    • Solid Financials: Exceptional financial health provides a buffer against economic shocks and supports sustained corporate value.
    • Stable Returns: A half-year 2025 Return on Equity (ROE) of 6.79% is a healthy figure, showcasing stable profit generation relative to shareholder equity.

    Potential Risk Factors

    • Revenue Concerns: If the revenue sluggishness persists, it could raise long-term questions about growth potential in an increasingly competitive market.
    • Macroeconomic Volatility: Persistent high interest rates and currency fluctuations can impact funding costs and derivative valuations, introducing potential earnings volatility.
    • Intensifying Competition: The rise of agile FinTech players continues to exert pressure on traditional card issuers. For more on this, see our deep dive into the Korean FinTech market.

    💡 Investor Action Plan: Our ‘Neutral’ Recommendation

    While the SAMSUNG CARD CO.,LTD Q3 2025 earnings report contains significant positive elements, the revenue miss and macroeconomic uncertainties warrant a cautious approach. We recommend a ‘Neutral’ stance on Samsung Card stock.

    Investors should closely monitor the upcoming Q4 2025 results for signs of a revenue rebound and continued margin strength. The key will be whether Samsung Card can translate its operational efficiency into sustainable, long-term growth. For now, its demonstrated resilience makes it a stock to watch closely, but exercising prudence is the wisest course of action.

    (029780) Samsung Card (029780) Q3 2025 Earnings Analysis: Profit Beats Forecasts – Is the Stock a Buy? 관련 이미지
  • (218410) RFHIC CORPORATION (218410) Stock: Deep Dive into Q3 2025 Earnings Surprise & Future Outlook

    (218410) RFHIC CORPORATION (218410) Stock: Deep Dive into Q3 2025 Earnings Surprise & Future Outlook

    The latest Q3 2025 earnings report from RFHIC CORPORATION (218410) has sent ripples through the market, presenting investors with a complex but intriguing picture. While top-line revenue slightly missed consensus, a significant ‘earnings surprise’ in operating profit has captured attention. However, this was contrasted by a shortfall in net income, raising important questions about the company’s underlying financial health and future trajectory.

    This comprehensive analysis unpacks the RFHIC earnings for Q3 2025, exploring the fundamental drivers, technological advantages in GaN semiconductor technology, and the strategic risks that lie ahead. For current and prospective investors, understanding these nuances is critical to navigating the future of RFHIC stock.

    Dissecting the RFHIC CORPORATION Q3 2025 Earnings Report

    The preliminary Q3 2025 figures reveal a multi-faceted performance. The headline news was the impressive beat on operating profit, suggesting strong core operational efficiency or a favorable product mix. Let’s examine the key metrics against market forecasts:

    Key Performance Indicators (vs. Forecast)

    • Revenue: KRW 40.5 billion (1% below forecast of KRW 40.8 billion)
    • Operating Profit: KRW 7.4 billion (23% ABOVE forecast of KRW 6.0 billion) – A significant earnings surprise.
    • Net Income: KRW 5.7 billion (24% BELOW forecast of KRW 7.5 billion)

    The divergence between operating and net income suggests that while the company’s core business operations were more profitable than expected, non-operating factors likely weighed on the bottom line. This could include foreign exchange losses, higher interest expenses on debt, or other one-off financial costs. The full preliminary report can be accessed via this Official Disclosure from DART for further detail.

    The Engine Room: Core Strengths & GaN Technology Edge

    RFHIC CORPORATION’s ability to generate strong operating profit is rooted in its deep technological expertise, particularly in Gallium Nitride (GaN) semiconductors. GaN technology offers superior efficiency, power density, and frequency performance compared to traditional silicon-based chips, making it essential for next-generation applications.

    RFHIC’s unique position as the only domestic Korean company with end-to-end GaN transistor capabilities—from design to mass production—forms a powerful competitive moat in high-growth global markets.

    Primary Growth Pillars

    • Defense & Radar: A robust order backlog of KRW 148.2 billion for GaN power amplifiers in radar systems provides excellent revenue visibility and stability.
    • Wireless Communication: The ongoing global rollout of 5G infrastructure continues to demand high-performance GaN components, a core market for RFHIC.
    • New Frontiers: Strategic expansion into the burgeoning satellite communication and spacecraft sectors secures long-term growth drivers, tapping into a market projected to reach USD 580 billion by 2040. You can read more about the future of the satellite communications industry in our related analysis.

    Navigating Headwinds: Challenges on the Horizon

    Despite its strengths, RFHIC CORPORATION faces several challenges that investors must monitor closely. These risks could impact future profitability and stock performance if not managed effectively.

    Key Risks for RFHIC Stock

    • Revenue Concentration & Decline: A recent decline in the core ‘GaN Power Amplifiers’ segment is a concern. Reversing this trend is critical for sustained growth.
    • Reduced R&D Investment: The R&D expense ratio dropped significantly from 15.61% in 2023 to 6.49% in H1 2025. In a fast-evolving tech industry, sustained innovation is non-negotiable, and this trend could threaten long-term competitiveness. Discover more about the power of next-generation GaN semiconductors from authoritative sources like IEEE.
    • Inventory Management: A rising inventory level (from KRW 78.8 billion to KRW 88.9 billion) needs careful management to avoid potential write-downs and cash flow constraints.
    • Macroeconomic Pressures: While a weaker Korean Won helps export competitiveness, it also increases the cost of imported raw materials. Persistent high interest rates globally add to the company’s financial burden.

    Investment Outlook: What’s Next for RFHIC CORPORATION?

    The Q3 earnings report offers both catalysts and cautions. The operating profit beat provides a potential short-term boost to stock momentum, validating the company’s core operational strength. However, the market will be looking for confirmation that this is a sustainable trend and not a one-off event driven by cost-cutting.

    Key Investor Checklist

    Moving forward, investors should focus on these critical points in upcoming reports and company communications:

    • Q4 2025 Performance: Look for continued strength in operating profit and, crucially, a recovery in revenue from the GaN Power Amplifier segment.
    • New Business Monetization: Track progress on when new ventures in satellite and space will begin contributing meaningfully to the top and bottom lines.
    • Commitment to Innovation: Monitor R&D spending in future quarters. A return to higher investment levels would be a positive signal for long-term technological leadership.

    Disclaimer: This analysis is for informational purposes only and is based on publicly available data. It does not constitute investment advice. All investment decisions should be made based on your own research and judgment.

    (218410) RFHIC CORPORATION (218410) Stock: Deep Dive into Q3 2025 Earnings Surprise & Future Outlook 관련 이미지
  • (322000) HD HYUNDAI ENERGY SOLUTIONS Q3 2025 Earnings: Profit Surprise Signals Strong Investment Case?

    (322000) HD HYUNDAI ENERGY SOLUTIONS Q3 2025 Earnings: Profit Surprise Signals Strong Investment Case?

    The latest Q3 2025 earnings report from HD HYUNDAI ENERGY SOLUTIONS CO.,LTD. has presented investors with a compelling paradox. While top-line revenue fell short of market expectations, the company delivered a powerful ‘earnings surprise’ with operating profits that significantly beat forecasts. This divergence has sparked a critical question: Does this signal a temporary hiccup in sales or a fundamental strength in profitability and management efficiency?

    This comprehensive analysis unpacks the preliminary Q3 2025 results for HD HYUNDAI ENERGY SOLUTIONS, exploring the drivers behind the numbers, the company’s underlying financial health, and the broader market forces at play. We will provide a clear-eyed view to help you determine what’s next for your solar energy investment strategy.

    Key Highlights: HD HYUNDAI ENERGY SOLUTIONS Q3 2025 Results

    The preliminary operating results painted a mixed, yet ultimately optimistic, picture of the company’s performance. Here are the core figures that have captured the market’s attention. For a complete breakdown, investors can review the Official Disclosure filed with DART.

    • Revenue of KRW 121.0 billion: This figure fell approximately 10% short of the market consensus of KRW 134.4 billion, indicating a sales headwind during the quarter.
    • Operating Profit of KRW 14.7 billion: A significant outperformance, surging 25% past the market expectation of KRW 11.8 billion. This is the central ‘earnings surprise’.
    • Net Income of KRW 12.0 billion: The company successfully achieved a profitable quarter, reinforcing the positive signals about its underlying financial health and efficiency.

    Decoding the Paradox: Profit Surge Amidst Revenue Decline

    The most crucial aspect of the HD HYUNDAI ENERGY SOLUTIONS earnings report is understanding how profitability soared while sales dipped. This points to strong internal management offsetting external market pressures.

    Analyzing the Revenue Miss

    The Q3 revenue of KRW 121.0 billion marked a decrease from the previous quarter’s KRW 133.7 billion. This dip can be traced to a confluence of factors common in the global solar industry, including seasonal demand fluctuations and potential delays in the delivery schedules for large-scale utility projects. Furthermore, a weaker-than-anticipated intake of new orders during the quarter likely contributed. While this revenue miss could create short-term stock price volatility, its impact was largely overshadowed by the company’s operational excellence.

    The Bright Spot: Masterful Profitability Management

    The stellar operating profit is a testament to HD HYUNDAI ENERGY SOLUTIONS’ robust capabilities in cost management and operational efficiency. This wasn’t a matter of luck; it was a result of deliberate strategy:

    • Expense Optimization: Continuous efforts to streamline selling, general, and administrative (SG&A) expenses paid off, reducing overhead without sacrificing core operations.
    • Favorable Input Costs: Lower-than-expected costs for key raw materials like polysilicon provided a significant margin cushion.
    • High-Margin Product Mix: A strategic focus on selling more advanced, high-margin solar modules and energy storage systems (ESS) boosted the overall profitability per unit sold.

    This robust operating profit effectively mitigates the negative impact of the revenue miss, serving as a powerful indicator of the company’s fundamental ability to generate value even in a challenging sales environment.

    Investment Outlook: Is HD HYUNDAI ENERGY SOLUTIONS Stock a Buy?

    Given the mixed signals, a careful assessment is required. The future trajectory of the HD HYUNDAI ENERGY SOLUTIONS stock price will depend on whether the company can resolve its revenue challenges while maintaining its newfound profitability prowess. For more on this, see our guide on how to analyze solar energy stocks.

    The Bull Case (Positive Factors)

    • Proven Profitability: The earnings surprise demonstrates a powerful ability to control costs and manage margins effectively.
    • Solid Financials: A stable debt-to-equity ratio (25.73% as of H1 2025) and a profitable quarter signal strong financial health.
    • Favorable Market Tailwinds: The global push for carbon neutrality, driven by initiatives like the Paris Agreement, ensures long-term structural growth for the solar industry.

    The Bear Case (Risks to Consider)

    • Revenue Concerns: The company must demonstrate it can resolve the causes of the revenue miss and rekindle top-line growth.
    • Intense Competition: The global solar market is highly competitive, which can exert pressure on pricing and market share.
    • Macroeconomic Volatility: Fluctuations in exchange rates and raw material prices remain a persistent risk factor.

    Recommendation: Prudent investors should monitor for follow-up reports clarifying the Q3 revenue miss and providing a clear outlook for Q4 orders. However, the company’s demonstrated strength in profitability and solid fundamentals suggest that HD HYUNDAI ENERGY SOLUTIONS could represent an attractive long-term investment opportunity, especially if the positive trend in operating profit continues and top-line growth resumes.

    (322000) HD HYUNDAI ENERGY SOLUTIONS Q3 2025 Earnings: Profit Surprise Signals Strong Investment Case? 관련 이미지
  • (003670) POSCO FUTURE M Q3 Earnings Analysis: Profit Soars 127% – A 2025 Stock Deep Dive

    (003670) POSCO FUTURE M Q3 Earnings Analysis: Profit Soars 127% – A 2025 Stock Deep Dive

    The latest POSCO FUTURE M Q3 earnings report for 2025 has sent a complex but ultimately bullish signal to the market. On October 27, 2025, the leading Korean player in the battery materials industry announced preliminary results that defied expectations. While revenue fell short of forecasts, the company’s operating and net profits skyrocketed, marking a significant ‘earnings surprise.’ This detailed investment analysis will unpack these figures, explore the underlying drivers, and provide a clear outlook for investors weighing the future of POSCO FUTURE M stock.

    We’ll examine how enhanced operational efficiency trumped top-line weakness, what this means for the company’s position in the competitive EV battery materials sector, and the key risks and opportunities that lie ahead.

    The Q3 2025 Earnings Surprise in Detail

    POSCO FUTURE M’s preliminary Q3 results presented a fascinating paradox. While sales didn’t hit the mark, profitability roared back to life, decisively reversing the operating losses seen in previous quarters. According to the company’s Official Disclosure, the key metrics were:

    Revenue: KRW 781 billion (11% below estimate)
    Operating Profit: KRW 57.9 billion (127% above estimate)
    Net Profit: KRW 32 billion (176% above estimate)

    This massive beat on profit metrics demonstrates a significant improvement in the company’s underlying operational health. It suggests that while external market conditions may have tempered sales, internal cost controls and production efficiencies have more than compensated, laying a stronger foundation for future growth.

    Drivers of Profitability: A Look Under the Hood

    The surge in profitability wasn’t accidental. It stems from a combination of strategic positioning, financial prudence, and relentless operational improvements.

    Unique Position in the Battery Materials Industry

    POSCO FUTURE M holds a unique competitive advantage as Korea’s only company that mass-produces both cathode and anode materials—the two critical components of a battery. This vertical integration allows for greater control over the supply chain, potential cost synergies, and a more comprehensive offering to major battery manufacturers, positioning the company as a one-stop shop in a booming industry.

    Strengthened Financial Foundation

    Recent strategic financial maneuvers have bolstered the company’s balance sheet. Through a rights offering and the issuance of hybrid bonds, POSCO FUTURE M has secured significant capital. This not only improves its financial stability in a high-interest-rate environment but also provides the necessary war chest for aggressive investment in next-generation technologies and production capacity expansion, particularly in key markets like North America.

    Mastering Operational Efficiency

    The stellar POSCO FUTURE M Q3 earnings on the profit side are direct evidence of successful cost management. The results alleviate previous concerns about a profitability slowdown in the energy materials segment. This indicates the company is effectively navigating volatile raw material prices (like lithium and nickel) and optimizing production and logistics to protect its margins, a critical skill in the competitive battery materials industry.

    Investment Analysis: Outlook & Key Considerations

    For investors, the Q3 report provides a robust bull case but also highlights risks that require careful monitoring. The global EV market is projected to continue its rapid expansion, as reported by sources like BloombergNEF, which is a powerful tailwind. However, a nuanced approach is essential.

    The Bull Case: Why Be Optimistic?

    • Proven Profitability: The ‘earnings surprise’ proves the company can effectively manage costs and deliver strong profits even in a challenging sales environment.
    • Structural Growth: The company is a direct beneficiary of the unstoppable shift towards electric vehicles and energy storage solutions.
    • Strategic Investments: Aggressive expansion in North America, including joint ventures with giants like GM, positions the company to capitalize on policies like the Inflation Reduction Act (IRA). You can read more in our guide to investing in the EV supply chain.

    The Bear Case: Potential Risks to Monitor

    • The Revenue Miss: This cannot be ignored. It may signal a temporary slowdown in EV demand, production adjustments from key clients, or intensifying price competition. This trend needs to be watched closely in Q4.
    • Macroeconomic Headwinds: Volatility in raw material prices, foreign exchange rates, and global logistics costs remain persistent threats to profitability.
    • Geopolitical & Trade Risks: Potential U.S. tariffs or other trade policy shifts could impact the profitability of exports and disrupt supply chain strategies.

    Strategic Takeaway

    The Q3 2025 results for POSCO FUTURE M mark a potential turning point. While the revenue miss warrants caution, the dramatic improvement in profitability demonstrates a resilient and increasingly efficient operation. For the long-term investor, the focus should be on the company’s ability to execute its expansion plans and maintain its newfound margin discipline. The short-term reaction to the POSCO FUTURE M stock may be positive, but sustainable growth will depend on translating operational excellence into consistent top-line growth in the quarters to come.

    (003670) POSCO FUTURE M Q3 Earnings Analysis: Profit Soars 127% - A 2025 Stock Deep Dive 관련 이미지
  • (149950) AVATEC Q3 2025 Earnings Surprise: Deep Dive into Stock Potential & Investment Strategy

    (149950) AVATEC Q3 2025 Earnings Surprise: Deep Dive into Stock Potential & Investment Strategy

    The market received a jolt on October 21, 2025, as display component manufacturer AVATEC CO.,LTD. (아바텍) unveiled its preliminary AVATEC Q3 2025 earnings, delivering a stunning performance that significantly outpaced analyst expectations. The report, detailed in an Official DART Disclosure, revealed not just solid growth but an explosive surge in profitability, signaling a potential turning point for the company and its investors. This analysis will dissect the impressive results, explore the underlying factors driving this growth, and outline a strategic framework for evaluating an investment in AVATEC stock.

    Deconstructing the AVATEC Q3 2025 Earnings Surprise

    AVATEC’s preliminary Q3 results were impressive across the board, but the highlight was the astronomical beat on operating profit. The numbers paint a clear picture of a company firing on all cylinders.

    The core story is the 74% beat on operating profit. This isn’t just an incremental improvement; it’s a powerful signal of enhanced operational efficiency and a strengthening business model that the market had not yet priced into the AVATEC stock.

    Key Financial Highlights vs. Expectations

    • Revenue: 22.8 billion KRW, an 8% beat over the market’s expectation of 21.2 billion KRW.
    • Operating Profit: 3.3 billion KRW, a staggering 74% beat over the 1.9 billion KRW forecast.
    • Net Income: 3.0 billion KRW, a solid 7% beat over the expected 2.8 billion KRW.

    Why This Performance is a Game-Changer

    This earnings report is significant because it suggests a fundamental, structural improvement rather than a one-off positive event. The massive jump in operating profit, far exceeding revenue growth, points directly to enhanced profitability margins. This could be driven by several factors, including improved manufacturing yields, a more favorable product mix skewed towards high-margin items, or successful cost-control initiatives.

    Key Drivers of Momentum

    • Sustained Turnaround: The company has successfully transitioned from losses in late 2024 and early 2025 to a consistent profit-making trajectory, with Q3 marking a significant acceleration of this trend.
    • Impressive Sequential Growth: When compared to Q2 2025, operating profit surged by an incredible 154%. This demonstrates not just year-over-year recovery but powerful current momentum.
    • Strengthening Competitiveness: Such results suggest AVATEC is capturing more value within the supply chain, possibly due to proprietary technology or a strong position in a niche but growing segment of the global display market.

    Investment Strategy: Navigating the AVATEC Opportunity

    The positive AVATEC Q3 2025 earnings report is expected to catalyze a re-evaluation of the company’s stock by the market. However, a prudent investment strategy requires looking beyond the headlines. Here’s a step-by-step approach for potential investors.

    Phase 1: Immediate Analysis (Post-Announcement)

    Monitor Market Reaction: Observe the AVATEC stock price and trading volume in the days following the announcement. A strong positive reaction is expected, but watch for signs of profit-taking. The market’s ability to hold onto gains will indicate underlying investor confidence.

    Phase 2: Deep-Dive Due Diligence

    Scrutinize the Full Report: The preliminary numbers are exciting, but the full, detailed earnings report is crucial. Look for management’s commentary on which specific products or divisions drove the outperformance. Is it sustainable? What is the outlook for Q4 and beyond? Understanding these details is critical and you can learn more from our guide to analyzing quarterly earnings reports.

    Assess Industry Health: Evaluate the broader trends in the display and component manufacturing industry. Is AVATEC benefiting from a rising tide that lifts all boats, or is it outperforming its competitors through superior execution? Understanding the macroeconomic context is essential.

    Phase 3: Long-Term Positioning

    Evaluate Sustainability: The most important question for a long-term investor is whether this growth is sustainable. Look for evidence of a durable competitive advantage, such as strong R&D, new client contracts, or expansion into new high-growth areas like automotive displays or AR/VR components.

    Frequently Asked Questions (FAQ)

    Q1: What were AVATEC’s key Q3 2025 earnings figures?

    AVATEC reported preliminary Q3 2025 revenue of 22.8 billion KRW, operating profit of 3.3 billion KRW, and net income of 3.0 billion KRW, all significantly exceeding market forecasts.

    Q2: What was the biggest highlight of the AVATEC earnings report?

    The most notable achievement was the operating profit of 3.3 billion KRW, which was a massive 74% higher than the market’s forecast of 1.9 billion KRW, qualifying as a major ‘earnings surprise’.

    Q3: What does this improved performance suggest for the AVATEC stock?

    This performance is likely to boost investor confidence and could lead to a positive re-rating of the stock. It suggests strong underlying business health and improved profitability that may not have been fully appreciated by the market prior to the announcement.

    Disclaimer: This article is for informational purposes only and is based on publicly available preliminary data. It does not constitute financial advice. Investment decisions should be made based on your own comprehensive research, risk assessment, and consultation with a qualified financial advisor.

    (149950) AVATEC Q3 2025 Earnings Surprise: Deep Dive into Stock Potential & Investment Strategy 관련 이미지
  • (005930) Samsung Q3 2025 Earnings: 19% Profit Surge Signals AI Dominance & Stock Analysis

    (005930) Samsung Q3 2025 Earnings: 19% Profit Surge Signals AI Dominance & Stock Analysis

    The initial analysis of the Samsung Q3 2025 earnings report reveals a company firing on all cylinders, decisively shaking off market uncertainty. On October 14, 2025, Samsung Electronics Co., Ltd. (삼성전자) delivered a significant ‘earnings surprise,’ with preliminary results that didn’t just meet but dramatically surpassed analyst expectations. This performance, headlined by a remarkable surge in operating profit, reinforces Samsung’s pivotal role in the global tech landscape, particularly in the booming semiconductor and AI sectors.

    This in-depth report moves beyond the headline numbers. We will dissect the strategic maneuvers and market dynamics that fueled this success, offering a comprehensive Samsung stock analysis for investors. We’ll explore the future growth catalysts and potential challenges, providing a clear perspective on what these results mean for the road ahead.

    Deconstructing the Samsung Earnings Surprise

    According to the Official Disclosure filed with DART, Samsung’s preliminary consolidated earnings for the third quarter presented a picture of robust health and growth:

    • Revenue: KRW 86.0 trillion, outperforming estimates of KRW 83.9 trillion by 2.4%.
    • Operating Profit: KRW 12.1 trillion, soaring an incredible 19.5% above the consensus estimate of KRW 10.1 trillion.
    • Net Income: While not disclosed in the preliminary report, it is projected to comfortably exceed the estimated KRW 8.9 trillion.

    The nearly 20% beat on operating profit is the standout figure, a clear signal to the market that Samsung’s strategic initiatives are yielding substantial returns. This impressive growth is not an anomaly but the result of well-executed strategies across its diverse business divisions.

    “Samsung’s Q3 performance is a masterclass in execution. The surge in profitability, driven by the AI-fueled semiconductor boom, demonstrates a powerful convergence of market demand and technological leadership.”

    Key Drivers Behind the Q3 2025 Success

    Several key factors converged to produce these exceptional Samsung Q3 2025 earnings. The primary engine of this growth was the Device Solutions (DS) division, which capitalized on the insatiable demand for AI infrastructure.

    DS Division: The AI & Semiconductor Powerhouse

    The core of the earnings surprise lies in the remarkable Samsung semiconductor growth. The DS division benefited immensely from:

    • Explosive AI Demand: The global build-out of AI data centers created massive demand for high-performance server DRAM and enterprise SSDs. Samsung, a leader in this space, captured significant value as prices for these critical components firmed up.
    • Improved Profitability Mix: A strategic reduction in the supply of lower-margin legacy DRAM products, combined with rising market prices for high-end memory, significantly boosted the division’s profitability.
    • On-Device AI Momentum: The growing trend of integrating AI directly into smartphones and PCs is creating a new wave of demand, a trend Samsung is uniquely positioned to capitalize on with its integrated ecosystem. For more on market trends, see this Gartner report on AI semiconductors.

    DX Division: Premium Strategy Pays Off

    The Device eXperience (DX) division, encompassing mobile and consumer electronics, showed resilient performance through its focus on high-margin, premium products. The launch of the latest foldable phones and the continued integration of Galaxy AI features strengthened its market position and drove consumer upgrades, successfully navigating a competitive landscape.

    Future Outlook & Investment Thesis

    The Samsung Q3 2025 earnings report provides a strong bullish signal. The results boost investor confidence and set a positive tone for the coming quarters. However, a balanced investment approach requires considering both the opportunities and the risks.

    The Bull Case: Why Be Optimistic?

    • Sustained AI Growth: The AI revolution is still in its early stages. Samsung’s leadership in memory and foundry services positions it as a primary beneficiary of this long-term secular trend.
    • Market Dominance: The DX division’s strong brand and innovative product pipeline, especially in foldables and AI-integrated devices, should help it maintain market leadership.
    • Operational Efficiency: The impressive profit margin demonstrates effective cost management and productivity improvements that could lead to sustained earnings power.

    Risks and Considerations for Investors

    • Macroeconomic Headwinds: Global economic slowdowns or geopolitical instability could impact consumer spending and corporate investment, affecting all of Samsung’s divisions.
    • Intense Competition: The semiconductor, smartphone, and display markets are fiercely competitive. Investors should monitor for any shifts in market share or pricing power. Interested readers can learn about evaluating tech stock competition in our related guide.

    In conclusion, Samsung’s Q3 2025 performance is a powerful validation of its strategic focus on high-growth, high-margin sectors. For investors, the results reinforce the company’s status as a core holding in the technology sector, with the AI-driven semiconductor cycle poised to fuel its growth for the foreseeable future.

    (005930) Samsung Q3 2025 Earnings: 19% Profit Surge Signals AI Dominance & Stock Analysis 관련 이미지
  • (066570) LG Electronics Q3 2025 Earnings Report: Deep-Dive Analysis & Future Stock Outlook

    (066570) LG Electronics Q3 2025 Earnings Report: Deep-Dive Analysis & Future Stock Outlook

    The initial LG Electronics Q3 2025 earnings release has sent a clear signal to the market: the tech giant is not just meeting expectations, it’s decisively beating them. In a quarter watched with keen interest by investors, LG Electronics (ticker: 066570) has demonstrated remarkable financial resilience and strategic prowess. This comprehensive analysis will unpack the official numbers, explore the core drivers behind this success, evaluate future growth engines, and provide a clear investment strategy based on this stellar performance.

    Beyond the impressive headline figures, this report delves into the strategic shifts in cost management, product premiumization, and operational efficiency that have fortified LG’s bottom line. We’ll also assess the long-term viability of its ventures into robotics, AI, and vehicle components, providing a complete picture for any potential investor.

    LG Electronics Q3 2025 Earnings: A Significant Outperformance

    The term ‘earnings surprise’ aptly describes LG’s latest financial disclosure. The company recorded both revenue and operating profit figures that significantly surpassed consensus market estimates, as reported by sources like Reuters. This indicates not only robust demand but also exceptional execution.

    • Revenue: KRW 21.8751 Trillion (+3.5% above market expectation of KRW 21.1429 Trillion)
    • Operating Profit: KRW 688.9 Billion (+15.2% above market expectation of KRW 598.1 Billion)

    While the year-on-year revenue increase was moderate, the substantial leap in operating profit is the key story. This powerful growth in profitability highlights LG’s success in enhancing margins and operational health, moving beyond simple top-line expansion to create sustainable value.

    The Q3 results clearly demonstrate that LG’s focus on profitability and high-value business segments is paying significant dividends. This isn’t just a good quarter; it’s a validation of their long-term strategy.

    The Blueprint for Success: LG’s Winning Strategy

    This outstanding LG financial performance is not accidental. It’s the result of a multi-faceted and disciplined approach across the organization.

    Cost Control and Premium Product Focus

    LG has implemented rigorous cost management protocols across its supply chain, securing profitability even in a volatile market. Simultaneously, the company has doubled down on its premium product lines. The increased sales mix of high-margin products, such as OLED TVs and high-end home appliances, has directly boosted profit margins and strengthened brand equity.

    Enhanced Operational & Management Efficiency

    After navigating sluggish performance in late 2024, LG has successfully streamlined its internal processes. This overhaul has reduced unnecessary expenditures, increased productivity, and allowed the company to respond more nimbly to changing market dynamics, including favorable shifts in KRW/USD exchange rates which positively impacted this export-heavy business.

    Future Growth Engines and Industry Trends

    Beyond the current earnings, LG’s solid fundamentals are paving the way for future growth, with strategic investments in several high-potential sectors.

    • New Business Ventures: Strategic investments in robotics (highlighted by the Bear Robotics Inc. acquisition), smart homes, proprietary AI appliance chips, and the rapidly growing Vehicle component Solutions (VS) division are diversifying LG’s revenue streams.
    • Technological Leadership: Continued dominance in the OLED TV market, pioneering work in 6G communication, and the development of in-house AI chips create a powerful competitive moat. The AI chip, in particular, will enable significant product differentiation.
    • Strengthened ESG Management: A strong commitment to Environmental, Social, and Governance (ESG) principles is enhancing corporate value and building trust with modern investors. You can learn more about what this means for your portfolio here.
    • Stable Financials: An excellent credit rating ensures stable and low-cost access to capital, providing the flexibility needed to navigate economic uncertainty and fund future growth.

    Investment Strategy and Final Recommendation

    In light of the impressive LG Electronics Q3 2025 earnings, our LG stock analysis concludes with a positive outlook. The company’s ability to drive profitability while investing prudently in future technologies creates a compelling investment thesis.

    For a direct look at the numbers, refer to the Official Disclosure filed with DART.

    Investment Opinion: Buy (Mid-to-Long-Term Horizon)

    • Key Positives: Significant earnings beat, proven profitability improvements, clear strategy for future growth in high-margin sectors (AI, robotics, VS), and strong technological leadership.
    • Risks to Monitor: The costs associated with new business investments, intensifying global competition, and macroeconomic volatility related to currency and raw material prices require ongoing attention.

    While short-term market fluctuations are always possible, LG Electronics’ long-term growth trajectory appears robust. We recommend investors consider a mid-to-long-term position, focusing on the company’s continued execution and the tangible results from its strategic investments in next-generation technologies. The current trend of fundamental earnings improvement suggests high investment attractiveness.

    (066570) LG Electronics Q3 2025 Earnings Report: Deep-Dive Analysis & Future Stock Outlook 관련 이미지
  • Sanil Electric’s Q2 2025 Earnings: A Positive Surprise for Investors

    1. Sanil Electric Q2 2025 Earnings Analysis: Exceeding Expectations

    Sanil Electric reported revenues of KRW 128.2 billion and operating profit of KRW 46.1 billion in Q2 2025, surpassing market expectations by 9% and 7%, respectively. The robust growth in the power equipment division was a key driver of this success.

    2. Key Growth Driver: Strong Performance in Power Equipment

    Sanil Electric’s core business, the power equipment division, generated KRW 222.89 billion in revenue during the first half of 2025, representing 98.2% of total revenue. The company’s success in the US market, particularly in the 72.5kV and below distribution transformer segment, contributed significantly to this growth. Sanil Electric effectively captured demand from US power grid replacements and new investments.

    3. Future Growth Engine: Expansion into Renewable Energy

    Sanil Electric has established a subsidiary, Sanil Energy Co., Ltd., to expand into the renewable energy sector. With increasing government support and private sector demand, this new venture holds significant growth potential. Synergies with the existing power equipment business are also anticipated.

    4. Robust Financial Position: A Foundation for Stable Growth

    Sanil Electric boasts a strong financial position, with a debt-to-equity ratio of 12.89% as of the end of June. This indicates financial stability and provides a solid foundation for future expansion and investments.

    5. Investor Action Plan: Positive Outlook with Considerations

    Sanil Electric’s Q2 2025 results are highly encouraging and could drive positive momentum in the company’s stock price. However, investors should carefully monitor potential risk factors such as fluctuations in raw material prices and exchange rates, as well as the initial investment burden associated with the renewable energy business. Changes in foreign ownership rates should also be considered.

    Q: What is Sanil Electric’s main business?

    A: Sanil Electric’s core business is the manufacturing and sale of power equipment, specifically focusing on the 72.5kV and below distribution transformer market. They have recently expanded into the renewable energy sector for future growth.

    Q: How did Sanil Electric perform in Q2 2025?

    A: Sanil Electric exceeded market expectations in Q2 2025, reporting revenues of KRW 128.2 billion and operating profit of KRW 46.1 billion.

    Q: What should investors consider when evaluating Sanil Electric?

    A: Investors should monitor potential risks like fluctuations in raw material prices, exchange rates, and the initial investment burden in the renewable energy business. Changes in foreign ownership rates are also noteworthy.

  • Next Biomedical’s Earnings Surprise: A Deep Dive into Investment Strategies

    1. What Happened?: Next Biomedical Achieves Earnings Surprise

    Next Biomedical reported an earnings surprise in its 2025 semi-annual report, exceeding the operating profit consensus by +8%. While the market anticipated an operating loss of -500 million KRW, the company achieved a turnaround to profitability with an operating profit of 20.6 billion KRW.

    2. Why?: Consistent R&D Investment and Global Market Expansion

    This impressive performance can be attributed to the global market expansion of their endoscopic hemostatic agent and consistent R&D investments. Sales increased by 94.9% year-on-year to 774.4 billion KRW, and the growth potential of ‘Nexsphere™-F,’ which received FDA Breakthrough Device Designation, is also significant. Continuous R&D investment reaches 50% of sales, representing a strategic investment to secure future growth engines.

    3. So What?: Increased Investment Attractiveness and Momentum for Stock Price Growth

    This earnings surprise has significantly enhanced Next Biomedical’s investment appeal. The successful turnaround to profitability boosts market confidence and is likely to act as a momentum for stock price increases. Furthermore, a stable financial structure (debt-to-equity ratio of 32%) and ample liquidity (cash and cash equivalents of 407 billion KRW) further strengthen investment security. Global partnerships with Medtronic and CMI also serve as strong factors supporting Next Biomedical’s growth.

    4. Investor Action Plan: BUY Recommendation, Continuous Monitoring Required

    Currently, Next Biomedical is highly attractive for investment, warranting a BUY recommendation. However, continuous monitoring of potential risks, such as fluctuations in exchange rates and interest rates, and management of the R&D pipeline, is necessary. It is essential to continuously review global macroeconomic indicators and R&D investment performance and adjust investment strategies accordingly.

    Q: What was Next Biomedical’s operating profit for the first half of 2025?

    A: It was 20.6 billion KRW, marking a successful return to profitability.

    Q: What are Next Biomedical’s main products?

    A: Their main products include endoscopic hemostatic agents and Nexsphere™-F.

    Q: Should I invest in Next Biomedical?

    A: Currently, a BUY recommendation is given, but investment decisions should be made carefully based on individual judgment.

  • Cosmax BTI’s Q2 2025 Earnings Surprise: Unpacking the Growth Drivers

    1. Cosmax BTI Q2 2025 Earnings Analysis: Deconstructing the Surprise

    Despite a slight year-over-year decrease in consolidated revenue and operating profit, Cosmax BTI delivered a significant earnings beat, exceeding market projections. Notably, the company achieved a net profit turnaround, capturing investors’ attention. This success is attributed to the growth of its key subsidiaries, Cosmax NBT and Cosmax Bio, and its strategic expansion in overseas markets.

    2. Analyzing the Growth Drivers: Accelerating Global Market Penetration

    • Cosmax NBT: Achieved 65% overseas sales, improved profitability through sales subsidiary conversion, and strengthened global competitiveness.
    • Cosmax Bio: Secured technological competitiveness through the establishment of a new jelly production line and the development of individually recognized ingredients.

    3. Investment Considerations: Navigating External Risks and Uncertainties

    Despite the positive earnings momentum, investors should consider several key factors. Careful monitoring of the company’s high debt-to-equity ratio, exchange rate volatility, and macroeconomic uncertainties is crucial. Furthermore, the realization of R&D investments and the success of new business ventures will significantly impact long-term growth.

    4. Investment Strategies: Balancing Growth Potential with Risk Management

    Cosmax BTI’s earnings surprise may provide a short-term catalyst for stock price appreciation. However, investment decisions should be made cautiously, considering the sustainability of future earnings, external market dynamics, and the growth strategies of its subsidiaries.

    Frequently Asked Questions

    What is Cosmax BTI’s main business?

    Cosmax BTI operates as a holding company, managing and supporting the group’s businesses. Its core growth engine is the health functional food ODM business.

    How did Cosmax BTI perform in Q2 2025?

    The company posted KRW 163.7 billion in revenue, KRW 9.9 billion in operating profit, and KRW 7.2 billion in net profit, significantly exceeding market expectations.

    What are the key investment considerations for Cosmax BTI?

    Investors should consider the company’s high debt-to-equity ratio, exchange rate fluctuations, and macroeconomic uncertainties. Monitoring the realization of R&D investments and the success of new business ventures is also crucial.