Tag: Earnings Analysis

  • (003850) Boryung Corporation Q3 Earnings Analysis (2025): Deep Dive into Financials & Stock Forecast

    (003850) Boryung Corporation Q3 Earnings Analysis (2025): Deep Dive into Financials & Stock Forecast

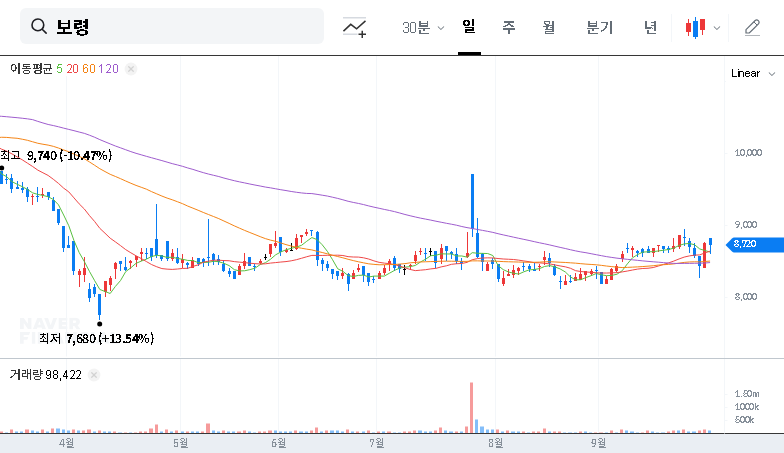
    Boryung Corporation (KRX: 003850) has just released its preliminary Q3 2025 financial results, signaling a powerful recovery and capturing the attention of investors. The latest Boryung Corporation Q3 earnings report reveals a significant upswing from the previous quarter, raising crucial questions about the company’s fundamental strength and future trajectory. Is this a sustainable turnaround or a temporary boost? This comprehensive analysis will dissect the numbers, explore the core drivers, and provide a strategic action plan for current and prospective investors.

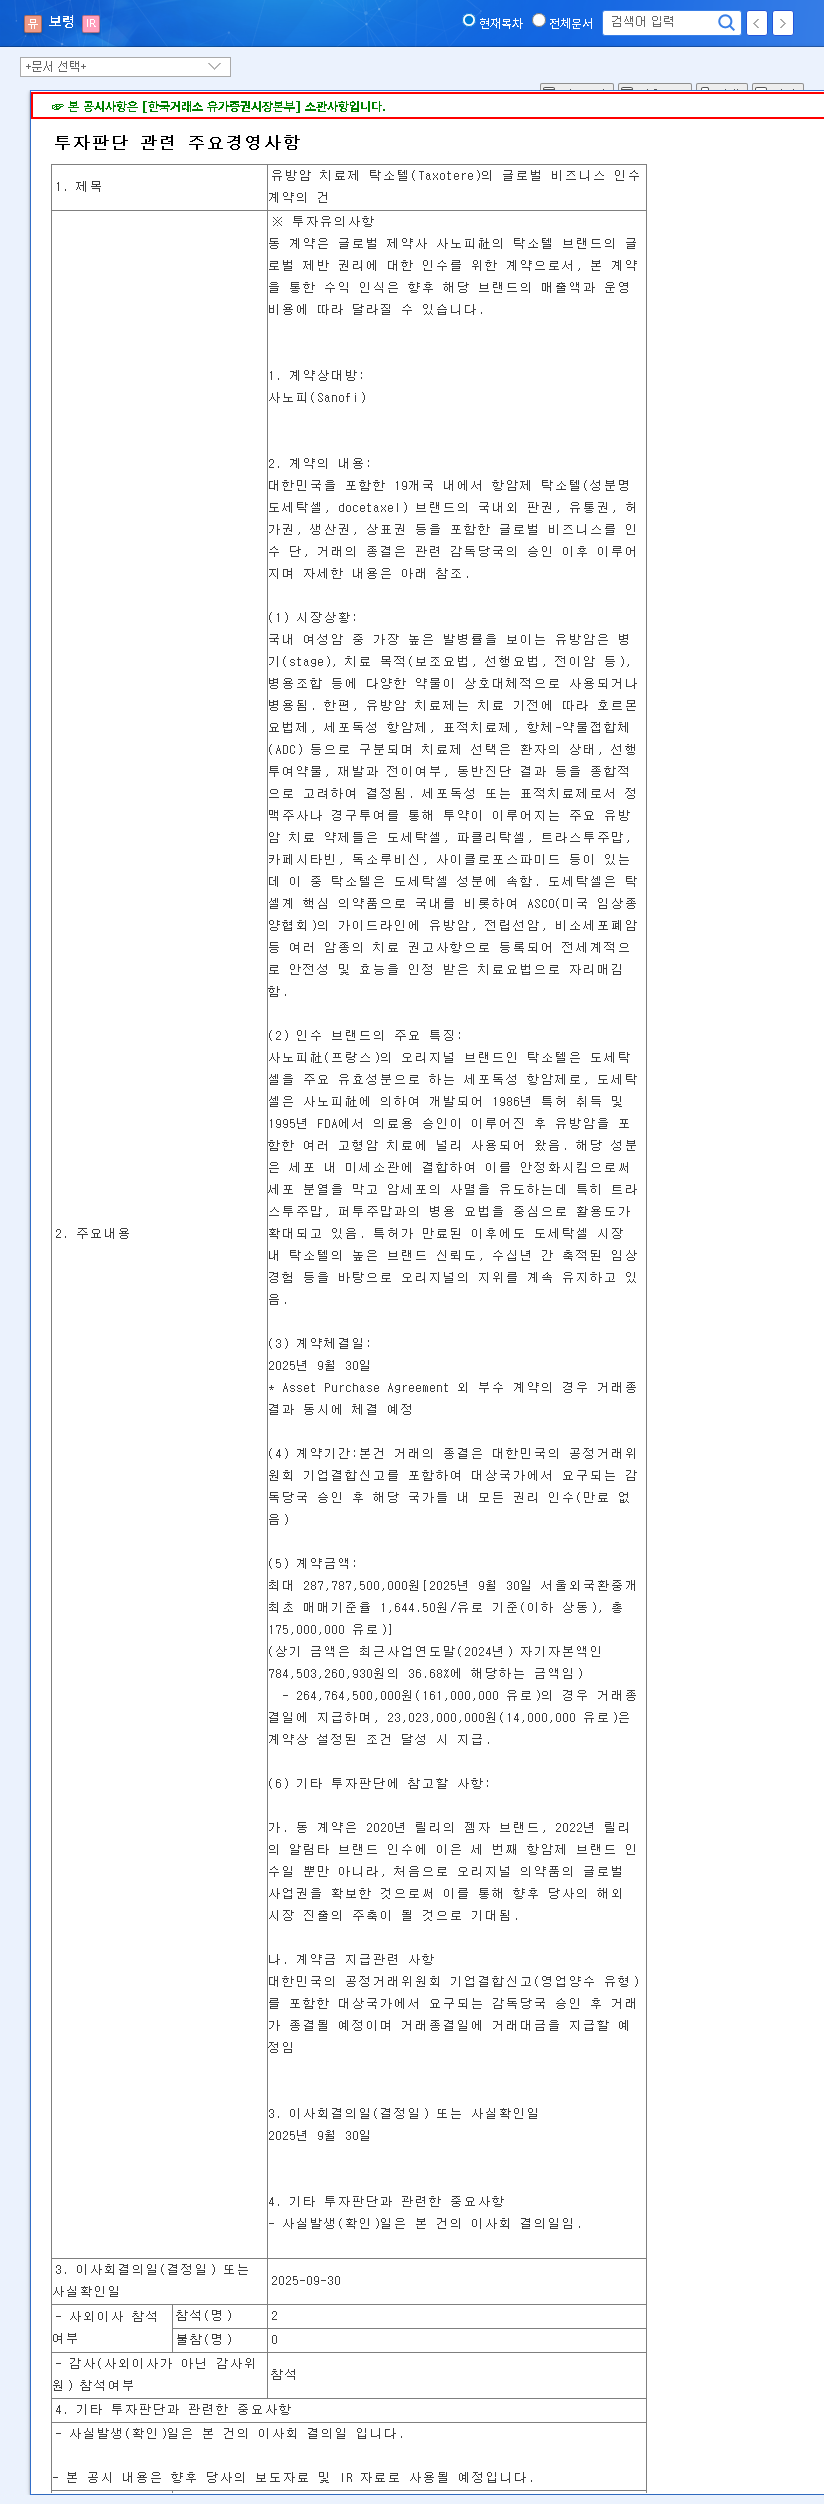
    On October 28, 2025, the company announced its consolidated preliminary earnings, showcasing impressive growth across key metrics. The official disclosure, available via Korea’s DART system (Source), confirms the preliminary figures and provides a basis for our deep dive.

    Boryung’s Q3 Preliminary Earnings: A Stunning Rebound

    The headline figures from the Q3 2025 report are a clear indicator of positive momentum. Compared to a sluggish Q2, Boryung has demonstrated remarkable resilience and growth. Here are the key highlights:

    • Sales Revenue: 280 billion KRW, an increase of 11.3% from Q2’s 251.5 billion KRW.
    • Operating Profit: 29.4 billion KRW, a solid 15.7% jump from Q2’s 25.4 billion KRW.
    • Net Profit: 34 billion KRW, a staggering 282% surge from Q2’s 8.9 billion KRW.

    The most striking figure is the 282% quarter-over-quarter surge in net profit. This massive leap suggests that Boryung’s strategic initiatives in portfolio optimization and profitability enhancement are beginning to yield substantial results.

    While these numbers are impressive on their own, it’s important to note that a direct comparison against market consensus (analyst expectations) is not yet available. The market’s full reaction will crystallize once these results are weighed against anticipated performance, a crucial factor for any Boryung stock analysis.

    Key Drivers Behind the Strong Performance

    Boryung’s robust Q3 performance isn’t accidental. It stems from a multi-pronged strategy focused on strengthening core competencies and optimizing business structures. Let’s explore the primary catalysts.

    1. Dominance in the Pharmaceutical Business

    The pharmaceutical segment remains Boryung’s primary growth engine. The strategic focus on high-margin, high-growth product lines has been particularly effective. The continued expansion of the Kanarb family of hypertension drugs and significant progress in the oncology pipeline are driving sales and reinforcing the company’s market position. Furthermore, the company’s R&D capabilities, highlighted by its EU-GMP acquisition, are bolstering its manufacturing competitiveness and opening doors for its CDMO (Contract Development and Manufacturing Organization) business.

    2. Consumer Healthcare Optimization

    While the first half of the year saw challenges in the over-the-counter (OTC) market, Boryung’s efforts to optimize its Consumer Healthcare business are paying dividends. By re-evaluating its product portfolio and focusing on core, profitable lines, the company is enhancing operational efficiency. This structural improvement is creating a more resilient foundation for long-term, sustainable growth in a competitive market.

    Macroeconomic Winds and Market Outlook

    No company operates in a vacuum. Broader economic trends significantly influence Boryung’s financial results. Key factors include exchange rate fluctuations, which can impact export competitiveness, and interest rate trends, which affect financing costs. The sustained growth of global pharmaceutical markets, driven by aging populations and an increase in chronic diseases, provides a favorable tailwind. For more on market trends, industry reports from authorities like Pharma Intelligence can offer valuable context. Boryung’s proactive expansion into overseas markets positions it well to capitalize on these global opportunities.

    Investor Action Plan: What to Monitor Now

    The strong Boryung Corporation Q3 earnings report is a positive signal, but savvy investors must look beyond the headlines. For those invested or considering an investment, here are the critical factors to monitor to assess the company’s long-term value. If you’re new to this sector, consider reviewing our guide to investing in pharmaceutical stocks.

    • Sustained Pharma Growth: Keep a close eye on sales figures for the Kanarb family and any updates on clinical trials and commercialization within the oncology pipeline.
    • Consumer Healthcare Turnaround: Look for tangible signs of performance improvement, such as new product launches and margin expansion in the CHC segment.
    • Shareholder-Friendly Policies: Confirm that actions like the recent treasury stock cancellation translate into sustained shareholder value and improved earnings per share (EPS).
    • Analyst Consensus Comparison: Once released, compare the final 003850 earnings report against analyst forecasts to gauge the market’s surprise and potential reaction.

    In conclusion, Boryung Corporation’s Q3 results suggest a company with improving fundamentals and a clear strategy for growth. While short-term stock price movement may be volatile, the long-term outlook appears promising. A careful review of upcoming finalized earnings and strategic updates will be essential for making an informed investment decision.

    (003850) Boryung Corporation Q3 Earnings Analysis (2025): Deep Dive into Financials & Stock Forecast 관련 이미지
    (003850) Boryung Corporation Q3 Earnings Analysis (2025): Deep Dive into Financials & Stock Forecast 관련 이미지
  • (175330) JB Financial Group Share Buyback & H1 2025 Earnings: A Deep Dive for Investors

    (175330) JB Financial Group Share Buyback & H1 2025 Earnings: A Deep Dive for Investors

    In a significant move for investors, JB Financial Group has released its H1 2025 earnings report, showcasing stable profitability, and simultaneously announced a substantial KRW 40 billion share buyback program. These developments raise critical questions: What do they signal about the company’s confidence? And how should investors position themselves in light of this news? This comprehensive analysis will break down the financial performance, explore the strategic implications of the share buyback, and provide a clear outlook on what’s next for JB Financial Group’s stock.

    This report moves beyond the headlines, offering actionable insights by dissecting the fundamental drivers and potential risks facing JB Financial Group. We aim to equip you with the knowledge needed to make informed investment decisions.

    Unpacking the H1 2025 Financial Performance

    JB Financial Group reported a consolidated net profit of KRW 370.4 billion for the first half of 2025. While this represents a marginal 0.1% year-over-year increase, the stability in a challenging macroeconomic environment is noteworthy. The overall performance was a mixed bag across its key subsidiaries, reflecting different market exposures and operational focuses.

    Subsidiary Performance Breakdown

    • Jeonbuk Bank: Posted a healthy net profit of KRW 116.6 billion, up 3.4%, demonstrating resilient growth.
    • Gwangju Bank: Saw a 7.9% decrease in net profit to KRW 148.4 billion, largely attributed to headwinds from a slowing real estate market and increased household loan risks.
    • JB Woori Capital: Continued its strong trajectory with a 6.6% profit increase to KRW 131.7 billion.
    • PPCBank (Cambodia): Contributed KRW 25.0 billion, highlighting the value of its international diversification.

    The Group’s fundamentals remain robust, with an industry-leading Return on Equity (ROE) of 13.1% and a low Cost-to-Income Ratio (CIR) of 35.8%. The Common Equity Tier 1 (CET1) Ratio stands at a stable 12.40%, indicating solid capital adequacy. For a detailed breakdown, you can view the Official Disclosure on the DART system.

    The KRW 40 Billion Share Buyback: A Signal of Confidence

    Perhaps the most significant news for investors is the decision to execute a KRW 40 billion JB Financial Group share buyback. This move, representing nearly 1% of the company’s market capitalization, is a powerful tool for enhancing shareholder value. A share buyback reduces the number of shares outstanding, which can increase key metrics like Earnings Per Share (EPS) and often leads to a higher stock price due to improved supply-demand dynamics.

    This action is widely interpreted as a signal from management that they believe the company’s stock is undervalued. By investing its own capital to repurchase shares, the board demonstrates strong confidence in the firm’s future prospects and financial stability. The buyback is scheduled to run from October 29, 2025, to February 3, 2026.

    Future Outlook: Opportunities and Risks

    While the buyback and stable earnings paint a positive picture, a balanced investment thesis requires examining both the potential upsides and the challenges ahead. Investors should stay informed by following broader market analysis from sources like Reuters Financial News.

    Key Investment Opportunities

    • Enhanced Shareholder Returns: The aggressive share buyback signals a commitment to returning capital to shareholders, which is highly attractive to investors.
    • Strong Profitability Metrics: High ROE and ROA relative to peers indicate efficient and profitable operations.
    • Digital Transformation: Ongoing investments in MyData services and fintech partnerships (e.g., Toss Bank) position the group for future growth in the digital banking landscape.

    Potential Headwinds to Monitor

    • Subsidiary Performance: The slowdown at Gwangju Bank needs to be watched closely, as prolonged weakness could drag down group results.
    • Asset Quality: The rising Non-Performing Loan (NPL) ratio at JB Woori Capital (2.71%) requires careful risk management to prevent further deterioration.
    • Macroeconomic Pressures: High inflation, interest rate volatility, and currency fluctuations pose risks to the entire banking sector’s profitability and credit quality.

    Conclusion: An Investor’s Action Plan

    The overall investment outlook for JB Financial Group appears positive, anchored by solid fundamentals and a strong commitment to shareholder value via the share buyback. The short-term impact of the buyback is likely to be supportive of the stock price.

    For the mid-to-long term, success will depend on the company’s ability to navigate the identified risks. Investors should monitor the performance recovery at Gwangju Bank, asset quality trends at JB Woori Capital, and the progress of its digital initiatives. For those looking to learn more about this sector, our guide on How to Analyze Bank Stocks provides valuable context. Ultimately, while JB Financial Group presents a compelling case, diligent monitoring of these key variables is essential for any investment strategy.

    Disclaimer: This analysis is for informational purposes only and does not constitute financial advice. All investment decisions should be made based on your own research and discretion.

    (175330) JB Financial Group Share Buyback & H1 2025 Earnings: A Deep Dive for Investors 관련 이미지
  • (207940) Samsung Biologics Q3 2025 Earnings: Record Profits & Future Stock Outlook

    (207940) Samsung Biologics Q3 2025 Earnings: Record Profits & Future Stock Outlook

    The latest Samsung Biologics earnings report for Q3 2025 has sent a powerful message to the market, showcasing a remarkable performance that didn’t just meet but dramatically exceeded analyst expectations. As a powerhouse in the global biopharmaceutical Contract Development and Manufacturing Organization (CDMO) space, Samsung Biologics (KRX: 207940) has demonstrated exceptional profitability and operational excellence. This in-depth analysis unpacks the key figures, explores the driving forces behind this success, and provides a forward-looking perspective on what this means for the Samsung Biologics stock and its future growth trajectory.

    Unpacking the Q3 2025 Earnings Surprise

    On October 28, 2025, Samsung Biologics released its provisional Q3 results, which can be viewed in the Official Disclosure (DART). The numbers reveal a company firing on all cylinders, with growth that significantly outpaced market consensus.

    • Revenue: KRW 1.66 trillion, surpassing expectations of KRW 1.61 trillion by 3.0%.
    • Operating Profit: KRW 728.8 billion, a staggering 25.4% above the market expectation of KRW 581.1 billion.
    • Net Profit: KRW 574.5 billion, an impressive 31.3% higher than the consensus of KRW 437.4 billion.

    The double-digit beat on operating and net profit is the clearest indicator of Samsung Biologics’ enhanced profitability and mastery of operational efficiency, a critical advantage in the competitive CDMO landscape.

    Key Drivers Behind the Strong Performance

    This outstanding financial performance wasn’t accidental. It’s the result of a multi-faceted strategy and favorable market conditions, solidifying the company’s leading position.

    Dominance in a Booming CDMO Market

    The global demand for biopharmaceuticals continues to surge, driven by advancements in treatments for complex diseases. As a leading CDMO, Samsung Biologics provides the essential development and manufacturing services that biotech and pharmaceutical companies need to bring these drugs to market. The strong Samsung Biologics Q3 2025 results reflect high utilization rates across its massive production facilities and a growing roster of high-value contracts with global pharmaceutical giants. To learn more about this sector, you can explore resources from authorities like the U.S. Food and Drug Administration (FDA) on biologics approvals.

    Exceptional Cost Management and Profitability

    The fact that profits grew much faster than revenue points to sophisticated operational control. Samsung Biologics has successfully optimized its processes, managed supply chain costs, and shifted its portfolio towards more complex, high-margin projects. This focus on high-value-added drug manufacturing is a key element of its strategy to enhance financial health and deliver superior returns. This directly impacts the long-term outlook for the Samsung Biologics stock.

    Future Outlook and Investor Considerations

    The stellar Samsung Biologics earnings report reinforces a bullish outlook, but investors should remain aware of both the opportunities and potential risks on the horizon.

    Continued Growth and Expansion

    Samsung Biologics is not resting on its laurels. The company’s growth strategy includes aggressive capacity expansion, with its new Plant 5 set to further cement its status as the world’s largest CDMO facility. This expansion allows the company to secure new pipelines and strengthen partnerships with major clients. For more details on their expansion plans, consider reading our analysis of the global CDMO market. This proactive approach positions them to capture an even larger share of the growing bio-industry.

    Investment Thesis & Risk Factors

    For investors, the case for Samsung Biologics is compelling:

    • Short-Term: The positive earnings news is likely to provide strong upward momentum for the stock price.
    • Long-Term: The company’s unmatched competitiveness and alignment with the structural growth of the CDMO market suggest significant long-term appreciation potential.

    However, diligence is key. Potential risks include a global economic slowdown impacting biopharma funding, intensifying competition from other CDMOs, and macroeconomic volatility in currency exchange rates. Geopolitical factors, particularly concerning U.S.-China relations, also warrant continuous monitoring.

    Conclusion

    The Q3 2025 Samsung Biologics earnings are more than just a set of impressive numbers; they are a clear confirmation of the company’s robust growth engine and strong market leadership. With a solid strategy for expansion and a proven track record of execution, Samsung Biologics (207940) remains a formidable player in the global biopharmaceutical industry, offering a compelling narrative for investors focused on long-term growth.

    (207940) Samsung Biologics Q3 2025 Earnings: Record Profits & Future Stock Outlook 관련 이미지
  • (055550) Shinhan Financial Group Q3 2025 Earnings: In-Depth Analysis & Stock Outlook

    (055550) Shinhan Financial Group Q3 2025 Earnings: In-Depth Analysis & Stock Outlook

    The SHINHAN FINANCIAL GROUP Q3 2025 earnings report has been released, delivering results that have significantly outpaced market consensus and highlighted the institution’s robust fundamentals. Amid ongoing global economic uncertainties, Shinhan’s performance serves as a key indicator of its strategic resilience and effective risk management. This analysis will provide a deep dive into the factors driving this success, the potential headwinds on the horizon, and what investors should be watching next for the Shinhan Financial Group stock.

    We’ll break down the key financial metrics, explore the synergy between its diverse business segments, and offer a forward-looking perspective on the company’s growth trajectory in the competitive financial landscape.

    Core Results: SHINHAN FINANCIAL GROUP Q3 2025 Earnings Overview

    On October 28, 2025, SHINHAN FINANCIAL GROUP CO., LTD announced its preliminary Q3 results, surprising the market with their strength. The detailed figures can be reviewed in the group’s Official Disclosure. The key financial indicators are as follows:

    • Revenue: KRW 9,514.8 billion
    • Operating Profit: KRW 1,954.6 billion (a significant 7.0% above market expectations)
    • Net Income: KRW 1,423.5 billion (exceeding market forecasts by 4.3%)

    The substantial beat on both operating profit and net income demonstrates that the group’s strong earnings growth trend has been successfully maintained. This performance underscores a healthy year-over-year expansion and solidifies Shinhan’s position as a market leader.

    Analysis of Key Performance Drivers

    Shinhan’s outstanding Q3 performance is not a coincidence but the result of multiple strategic pillars working in concert. However, a comprehensive Shinhan Financial Group analysis requires examining both the tailwinds and potential risks.

    Positive Factors: Pillars of Growth

    • Diversified Income Streams: A balanced growth in both net interest income and non-interest income was a primary driver. This highlights the success of the Group’s diversified business portfolio, reducing reliance on interest rate cycles.
    • Enhanced Shareholder Value: Proactive shareholder return policies, including consistent dividend payments and strategic share buybacks, have been met with a positive investor response, bolstering confidence in the Shinhan Financial Group stock.
    • Rock-Solid Capital Ratios: Maintaining a Common Equity Tier 1 (CET1) ratio of 13.59% demonstrates robust financial health and a strong capacity to absorb shocks, a crucial factor in today’s unpredictable economic climate.
    • Digital Transformation Success: Achieving 27.5 million Monthly Active Users (MAU) across its digital platforms is a testament to Shinhan’s successful digital strategy. This expands their service channels and creates long-term value through customer engagement and data analytics.
    • ESG Leadership: A strengthened focus on Environmental, Social, and Governance (ESG) initiatives, such as reducing greenhouse gas emissions, is enhancing the company’s brand and appealing to a growing base of socially conscious investors.

    Negative Factors and Macroeconomic Risks

    Despite the strong results, several risk factors warrant close monitoring:

    • Shinhan Capital Headwinds: The group’s capital arm faces profitability pressure due to increased loan loss provisions, particularly related to real estate Project Financing (PF) and bridge loans. Proactive risk management in this subsidiary is critical.
    • Global Economic Uncertainty: The broader financial industry is navigating challenges from potential interest rate shifts, economic slowdowns, and geopolitical risks. As reported by authoritative sources like Bloomberg, central bank policies in the U.S. and Eurozone will continue to create volatility.
    • Currency and Commodity Volatility: Fluctuations in the KRW/EUR exchange rate and volatile oil prices can impact international operations and corporate finance sectors, adding another layer of complexity to the Group’s performance.

    Market Context and Competitive Landscape

    The SHINHAN FINANCIAL GROUP Q3 2025 earnings report is expected to provide a positive catalyst for its stock, which saw an upward trend in the first half of the year. When placed in context, Shinhan’s performance, particularly in non-interest income and digital growth, appears strong relative to its domestic peers. How effectively the group navigates sector-wide risks, such as the downturn in real estate PF loans, will be a key differentiator. For a more detailed comparison, see our Full 2025 Korean Banking Sector Outlook.

    Despite macroeconomic headwinds, Shinhan Financial Group’s robust fundamentals, diversified portfolio, and commitment to shareholder returns position it as a resilient player. The key for investors is to monitor the management of credit risks and the strategic expansion of its digital and non-interest income streams.

    Investor Action Plan & Future Outlook

    Looking ahead, Shinhan Financial Group has demonstrated its ability to generate stable, impressive performance. Investors should focus on the following key areas to gauge future momentum:

    • Potential for full-year 2025 earnings forecast upgrades following this strong quarter.
    • Trends in Shinhan Capital’s asset quality and profitability improvement measures.
    • The ongoing expansion of non-interest income across key business segments.
    • Tangible outcomes from new digital business initiatives and ESG management efforts.

    In conclusion, the Shinhan Financial Group performance in Q3 2025 validates its strategic direction and showcases high future growth potential. Continuous monitoring and thorough analysis are encouraged for informed investment decisions.

    Frequently Asked Questions

    Q: Did Shinhan Financial Group’s Q3 2025 earnings meet expectations?

    A: Yes, they significantly exceeded expectations. Operating profit was 7.0% above market consensus, and net income surpassed forecasts by 4.3%, marking a stellar quarter.

    Q: What were the main drivers behind Shinhan’s strong performance?

    A: Key positive factors include balanced growth in interest and non-interest income, proactive shareholder return policies, stable capital ratios, strong digital platform growth, and enhanced ESG management.

    Q: What are the primary risks for Shinhan Financial Group?

    A: Investors should be aware of the performance slowdown at Shinhan Capital, particularly related to real estate PF loans, and broad macroeconomic uncertainties such as interest rate shifts and currency volatility.

    (055550) Shinhan Financial Group Q3 2025 Earnings: In-Depth Analysis & Stock Outlook 관련 이미지
  • (003670) POSCO FUTURE M Q3 Earnings Analysis: Profit Soars 127% – A 2025 Stock Deep Dive

    (003670) POSCO FUTURE M Q3 Earnings Analysis: Profit Soars 127% – A 2025 Stock Deep Dive

    The latest POSCO FUTURE M Q3 earnings report for 2025 has sent a complex but ultimately bullish signal to the market. On October 27, 2025, the leading Korean player in the battery materials industry announced preliminary results that defied expectations. While revenue fell short of forecasts, the company’s operating and net profits skyrocketed, marking a significant ‘earnings surprise.’ This detailed investment analysis will unpack these figures, explore the underlying drivers, and provide a clear outlook for investors weighing the future of POSCO FUTURE M stock.

    We’ll examine how enhanced operational efficiency trumped top-line weakness, what this means for the company’s position in the competitive EV battery materials sector, and the key risks and opportunities that lie ahead.

    The Q3 2025 Earnings Surprise in Detail

    POSCO FUTURE M’s preliminary Q3 results presented a fascinating paradox. While sales didn’t hit the mark, profitability roared back to life, decisively reversing the operating losses seen in previous quarters. According to the company’s Official Disclosure, the key metrics were:

    Revenue: KRW 781 billion (11% below estimate)
    Operating Profit: KRW 57.9 billion (127% above estimate)
    Net Profit: KRW 32 billion (176% above estimate)

    This massive beat on profit metrics demonstrates a significant improvement in the company’s underlying operational health. It suggests that while external market conditions may have tempered sales, internal cost controls and production efficiencies have more than compensated, laying a stronger foundation for future growth.

    Drivers of Profitability: A Look Under the Hood

    The surge in profitability wasn’t accidental. It stems from a combination of strategic positioning, financial prudence, and relentless operational improvements.

    Unique Position in the Battery Materials Industry

    POSCO FUTURE M holds a unique competitive advantage as Korea’s only company that mass-produces both cathode and anode materials—the two critical components of a battery. This vertical integration allows for greater control over the supply chain, potential cost synergies, and a more comprehensive offering to major battery manufacturers, positioning the company as a one-stop shop in a booming industry.

    Strengthened Financial Foundation

    Recent strategic financial maneuvers have bolstered the company’s balance sheet. Through a rights offering and the issuance of hybrid bonds, POSCO FUTURE M has secured significant capital. This not only improves its financial stability in a high-interest-rate environment but also provides the necessary war chest for aggressive investment in next-generation technologies and production capacity expansion, particularly in key markets like North America.

    Mastering Operational Efficiency

    The stellar POSCO FUTURE M Q3 earnings on the profit side are direct evidence of successful cost management. The results alleviate previous concerns about a profitability slowdown in the energy materials segment. This indicates the company is effectively navigating volatile raw material prices (like lithium and nickel) and optimizing production and logistics to protect its margins, a critical skill in the competitive battery materials industry.

    Investment Analysis: Outlook & Key Considerations

    For investors, the Q3 report provides a robust bull case but also highlights risks that require careful monitoring. The global EV market is projected to continue its rapid expansion, as reported by sources like BloombergNEF, which is a powerful tailwind. However, a nuanced approach is essential.

    The Bull Case: Why Be Optimistic?

    • Proven Profitability: The ‘earnings surprise’ proves the company can effectively manage costs and deliver strong profits even in a challenging sales environment.
    • Structural Growth: The company is a direct beneficiary of the unstoppable shift towards electric vehicles and energy storage solutions.
    • Strategic Investments: Aggressive expansion in North America, including joint ventures with giants like GM, positions the company to capitalize on policies like the Inflation Reduction Act (IRA). You can read more in our guide to investing in the EV supply chain.

    The Bear Case: Potential Risks to Monitor

    • The Revenue Miss: This cannot be ignored. It may signal a temporary slowdown in EV demand, production adjustments from key clients, or intensifying price competition. This trend needs to be watched closely in Q4.
    • Macroeconomic Headwinds: Volatility in raw material prices, foreign exchange rates, and global logistics costs remain persistent threats to profitability.
    • Geopolitical & Trade Risks: Potential U.S. tariffs or other trade policy shifts could impact the profitability of exports and disrupt supply chain strategies.

    Strategic Takeaway

    The Q3 2025 results for POSCO FUTURE M mark a potential turning point. While the revenue miss warrants caution, the dramatic improvement in profitability demonstrates a resilient and increasingly efficient operation. For the long-term investor, the focus should be on the company’s ability to execute its expansion plans and maintain its newfound margin discipline. The short-term reaction to the POSCO FUTURE M stock may be positive, but sustainable growth will depend on translating operational excellence into consistent top-line growth in the quarters to come.

    (003670) POSCO FUTURE M Q3 Earnings Analysis: Profit Soars 127% - A 2025 Stock Deep Dive 관련 이미지
  • (101490) S&S TECH CORPORATION Stock Analysis (101490): EUV Growth vs. Q3 Dip

    (101490) S&S TECH CORPORATION Stock Analysis (101490): EUV Growth vs. Q3 Dip

    This comprehensive S&S TECH CORPORATION stock analysis (KRX: 101490) delves into the critical question facing investors today: Can the company’s ambitious bet on the future of semiconductor technology overcome its recent short-term stumbles? S&S TECH recently reported Q3 2025 earnings that fell short of market consensus, casting a shadow over its immediate prospects. The numbers reflect a challenging period for the broader IT industry. However, beneath the surface of these disappointing results lies a strategic pivot towards long-term dominance through sustained investment in EUV (Extreme Ultraviolet) blank masks and pellicles. We’ll dissect the fundamentals, explore the market dynamics, and provide a strategic outlook on this potential semiconductor growth stock.

    Deconstructing the Q3 2025 Earnings Miss

    Performance Below Expectations

    In its third quarter of 2025, S&S TECH CORPORATION reported sales of 61.5 billion KRW and an operating profit of 11.9 billion KRW. These figures represented a slight miss against analyst forecasts, with year-on-year declines in both key metrics signaling a persistent slowdown. The performance clearly illustrates the headwinds from a sluggish global IT market recovery. For a detailed breakdown, investors can review the Official Disclosure (DART).

    Fundamental Health Check

    A deeper dive into the company’s fundamentals reveals a mixed but strategic picture:

    • Profitability Pressures: The first half of 2025 saw a consolidated revenue decrease of 32.6% year-on-year, driven by softer demand in core semiconductor and display markets.
    • Strategic Investments: Despite the downturn, S&S TECH is forging ahead with facility investments for its S&S TECH EUV division, a critical move to capture the next wave of semiconductor manufacturing.
    • Financial Stability: The company maintains a healthy debt-to-equity ratio of 20.87%. However, rising short-term borrowings necessitate vigilant financial management in the current interest rate environment.
    • R&D Scrutiny: A notable point of concern is the decline in the R&D-to-sales ratio, which fell from 10.7% to 6.0% year-on-year. This will be a key metric for investors to watch.

    The core of any 101490 investment thesis rests on whether you believe the long-term potential of the EUV pellicle market outweighs the current, cyclical downturn in the semiconductor industry.

    The EUV Revolution: S&S TECH’s Growth Engine

    Extreme Ultraviolet (EUV) lithography is the cutting-edge technology used to manufacture the world’s most advanced microchips. It allows for the creation of smaller, faster, and more power-efficient processors. S&S TECH is positioning itself as a key supplier of two indispensable components for this process: EUV blank masks and pellicles. The pellicle, a thin membrane that protects the photomask from contamination, is particularly crucial and represents a high-margin opportunity. As industry giants like TSMC, Samsung, and Intel expand their EUV capacity, the demand for high-quality components from specialists like S&S TECH is expected to soar. This strategic focus is the primary reason many analysts maintain a long-term bullish outlook despite short-term performance issues.

    Market Environment & Risk Factors

    Navigating Macroeconomic Headwinds

    The broader economic landscape presents both challenges and opportunities. The slowdown in the global semiconductor market, a key factor in the Q3 results, is expected to persist in the short term. Furthermore, macroeconomic variables create a complex operating environment:

    • Exchange Rates: A strong US Dollar can boost the price competitiveness of exports but also increases the cost of imported raw materials.
    • Interest Rates: While easing global rates could spur investment, the current high levels continue to pressure corporate borrowing costs.

    Short-Term vs. Long-Term Outlook

    Investors should differentiate between the immediate and future horizons. In the next 1-3 months, the stock may face continued pressure from weak sentiment and potential for another soft quarter. However, looking out 6-12 months and beyond, the narrative shifts. A recovery in the IT market, combined with tangible revenue from the S&S TECH EUV business, could lead to a significant re-evaluation of the company’s stock price. For more on cyclical market trends, you can read about understanding technology investment cycles.

    Investment Strategy & Comprehensive Opinion

    Our S&S TECH CORPORATION stock analysis concludes that the company is at a classic inflection point. While short-term headwinds are undeniable, the long-term growth story, centered on the high-barrier-to-entry EUV market, remains compelling.

    • For Short-Term Traders: Caution is advised. Increased volatility is likely. A phased buying strategy could be considered if the stock price sees a significant decline, but this approach carries risk until clear signs of an IT sector recovery emerge.
    • For Long-Term Investors: For those with a multi-year horizon who believe in the explosive growth of the EUV ecosystem, the current price weakness could present a strategic entry point for building a position in a key technology enabler. Continuous monitoring of the company’s progress in monetizing its EUV investments is essential.

    (101490) S&S TECH CORPORATION Stock Analysis (101490): EUV Growth vs. Q3 Dip 관련 이미지
  • (058430) POSCO STEELEON Q3 2025 Earnings: In-Depth Analysis & Future Investment Strategy

    (058430) POSCO STEELEON Q3 2025 Earnings: In-Depth Analysis & Future Investment Strategy

    The latest POSCO STEELEON Q3 2025 earnings report has sent ripples through the investment community. On October 27, 2025, POSCO STEELEON Co.,Ltd. (058430), a prominent name in the steel industry, released preliminary figures that confirmed a challenging quarter, marked by a significant decline in profitability. This detailed POSCO STEELEON analysis unpacks the numbers, explores the underlying causes—from macroeconomic pressures to internal dynamics—and outlines a clear investment strategy for navigating the path ahead.

    For investors holding or considering 058430 stock, understanding these results is crucial. We will examine the company’s strategic pivots, including high-value product development and overseas expansion, to assess its long-term potential against the backdrop of a volatile global market.

    Breaking Down the POSCO STEELEON Q3 2025 Earnings Report

    The official Q3 preliminary results, released on October 27, 2025, painted a clear picture of the headwinds the company faces. The key financial metrics, when compared to the previous quarter (Q2 2025), show a distinct downward trend in profitability, which has heightened market concerns. You can view the complete filing here: Official Disclosure (DART).

    Here are the headline numbers from the report:

    • Revenue: KRW 275.1 billion, a decrease of 3.2% from Q2’s KRW 284.1 billion.
    • Operating Profit: KRW 4.3 billion, a sharp decline of 21.8% from Q2’s KRW 5.5 billion.
    • Net Income: KRW 3.8 billion, a 5.0% drop from Q2’s KRW 4.0 billion.

    While the revenue dip was moderate, the significant contraction in operating profit signals severe pressure on margins. This trend has been accelerating throughout 2025, raising questions about cost management and pricing power.

    Why the Decline? Key Factors Impacting Performance

    The dip in performance isn’t due to a single issue but a confluence of fundamental, macroeconomic, and industry-specific challenges. A deeper POSCO STEELEON analysis reveals the complex environment the company is navigating.

    Challenging Macroeconomic Headwinds

    The global economic climate has been unforgiving. Key factors include:

    • Exchange Rate Volatility: While a weaker Korean Won can boost export competitiveness, it significantly inflates the cost of imported raw materials, a critical input for steel production. The strengthening Euro further pressures costs from European suppliers.
    • Global Demand Slump: Key demand sectors like construction and automotive manufacturing are experiencing a slowdown. This directly impacts sales volumes for coated and color steel sheets. For more on this, read about the current state of global construction trends.
    • Rising Interest Rates: Higher financing costs increase the burden of corporate debt and can delay capital-intensive projects, further dampening demand.

    POSCO STEELEON finds itself at a crossroads, squeezed by rising input costs on one side and weakening global demand on the other. The Q3 2025 results are a clear reflection of this immense pressure.

    Competitive Business Environment & Strategic Response

    The steel industry outlook is characterized by oversupply and intense competition. In response, POSCO STEELEON is not standing still. The company is actively pursuing a strategy focused on high-value-added products to protect its margins. A prime example is PosART, its high-resolution inkjet printed steel sheet, which targets premium architectural and home appliance markets. Success in this niche could provide a buffer against commoditized market pressures.

    Furthermore, the company’s expansion into Southeast Asia via its Myanmar subsidiary represents a crucial effort to diversify revenue streams away from saturated markets. However, geopolitical risks and the uncertainty of US tariffs on steel products remain significant external threats that could impact future performance, a sentiment echoed by the World Steel Association’s recent forecast.

    Actionable Investment Strategy for 058430 Stock

    Given the continued decline in profitability and the lack of immediate positive catalysts, a ‘Neutral’ investment opinion is maintained. A short-term rebound appears unlikely without a significant improvement in market conditions. However, long-term investors should keep a close watch on key strategic developments. Here is a recommended investment strategy and factors to monitor:

    • Q4 Performance Indicators: Monitor changes in sales prices and volumes. Any stabilization or uptick could signal a bottoming out of the current trend.
    • High-Value Product Traction: Look for specific data on the sales contribution and profit margins of products like PosART. Growing adoption is a key pillar of the long-term growth story.
    • Risk Management Effectiveness: Assess the company’s commentary on how it is managing raw material costs and currency exposure. Effective hedging can protect margins.
    • Trade Policy Developments: Stay informed about any changes or resolutions regarding US tariffs, as this is a major source of uncertainty for the export business.

    Frequently Asked Questions

    What were the key takeaways from POSCO STEELEON’s Q3 2025 earnings?

    The main takeaway is the significant deterioration in profitability. While revenue saw a minor 3.2% dip, operating profit plunged by 21.8% compared to the previous quarter. This indicates severe margin pressure from both high raw material costs and weakening demand.

    What is the company’s strategy to improve performance?

    POSCO STEELEON is focusing on two main areas: 1) Shifting its product mix towards high-value-added items like PosART (high-resolution printed steel sheets) to improve margins. 2) Expanding into new overseas markets, such as Southeast Asia, to diversify revenue and reduce reliance on mature, competitive markets.

    What is the current investment outlook for 058430 stock?

    The current outlook is ‘Neutral.’ The ongoing profitability challenges and macroeconomic headwinds limit short-term upside. Investors should wait for clear signs of a turnaround, such as stabilizing margins or successful market penetration of new products, before adopting a more bullish stance.

    (058430) POSCO STEELEON Q3 2025 Earnings: In-Depth Analysis & Future Investment Strategy 관련 이미지
  • (058430) POSCO STEELEON Q3 2025 Earnings: A Deep Dive into Profit Decline & Stock Outlook

    (058430) POSCO STEELEON Q3 2025 Earnings: A Deep Dive into Profit Decline & Stock Outlook

    The latest POSCO STEELEON Q3 2025 earnings report, released on October 27, 2025, presents a complex picture for investors. While the company demonstrated resilience with stable top-line revenue, a sharp contraction in profitability has sounded alarm bells. This analysis drills down into the numbers, unpacks the external pressures and internal strengths, and provides a comprehensive investment outlook for POSCO STEELEON’s stock.

    Despite maintaining revenue amidst a challenging market, POSCO STEELEON’s operating profit was halved year-over-year. The core challenge lies in navigating volatile raw material costs and currency fluctuations, which are severely impacting margins.

    Unpacking the POSCO STEELEON Q3 2025 Earnings Report

    According to the company’s provisional third-quarter announcement, POSCO STEELEON posted consolidated revenue of KRW 282.6 billion. This figure shows remarkable stability, only slightly down from Q2 2025 (KRW 284.1 billion) and nearly identical to the same period last year (KRW 283.4 billion). This suggests the company is successfully defending its market share even as demand slows. The full Official Disclosure provides further details.

    However, the story changes dramatically when looking at profitability. Operating profit tumbled to KRW 5 billion, a steep 51% drop from Q3 2024’s KRW 10.3 billion. Net profit followed suit, falling to KRW 3.9 billion. This stark divergence between a steady top line and a collapsing bottom line is the central issue for investors and warrants a deeper investigation into the underlying causes.

    Profitability Under Pressure: A Tale of Two Forces

    The Q3 profitability decline isn’t due to a single factor but rather a confluence of powerful external headwinds clashing with the company’s internal operational strengths. A detailed profitability analysis is crucial.

    External Headwinds Squeezing Margins

    Several macroeconomic factors are directly impacting POSCO STEELEON’s costs and are the primary culprits behind the profit dip:

    • Raw Material Volatility: The rising costs of key inputs, such as cold-rolled steel sheets, zinc, and specialty paints, have increased the cost of goods sold. This directly compresses gross margins, especially when market conditions prevent passing the full cost increase to customers.
    • Adverse Currency Exchange Rates: With exports accounting for roughly 45% of its business, the company is highly exposed to FX volatility. A weakening Korean Won against the US Dollar can increase the cost of imported raw materials, eroding profitability even if export revenues appear higher when converted back to KRW.
    • Global Economic Slowdown: Weakening economic conditions in key markets, as reported by institutions like the World Bank, reduce demand in crucial end-user industries like construction, automotive, and home appliances. This limits pricing power and sales volume growth.

    Internal Strengths Providing a Buffer

    Despite the challenging environment, the company’s financial results reveal a solid foundation that prevents a worse outcome:

    • Robust Financial Health: A stable debt-to-equity ratio of 44.5% and positive operating cash flow of KRW 29.4 billion indicate a sound financial structure. Efficient inventory management is also evident from a reduction in inventory levels.
    • High-Value Product Mix: A strategic focus on premium products like PosART (artistic steel sheets) and high-resolution inkjet printed steel helps secure higher margins than commodity products, providing a crucial buffer against cost pressures. You can learn more by reading our deep dive into the global steel market trends.
    • Strategic Market Expansion: The operation of its Myanmar plant signifies a proactive approach to tapping into high-growth Southeast Asian markets, diversifying revenue streams away from mature economies.

    Investment Outlook and Action Plan

    Given the conflicting signals from the Q3 report, the immediate outlook for POSCO STEELEON stock is neutral with a cautious tilt. The market is likely to react negatively to the sharp profit decline, potentially leading to short-term downward pressure on the stock price.

    For long-term investors, the focus should be on whether the company’s fundamental strengths can outweigh the current macroeconomic headwinds. The key going forward will be management’s strategy for cost control and currency hedging. Any guidance from the company on margin improvement initiatives in the upcoming quarters will be critical for restoring investor confidence.

    Investors should closely monitor Q4 and 2026 earnings forecasts, paying special attention to operating margin trends. While short-term volatility is expected, the company’s strong financial footing and strategic focus on high-value products provide a compelling case for its long-term resilience and growth potential.

    (058430) POSCO STEELEON Q3 2025 Earnings: A Deep Dive into Profit Decline & Stock Outlook 관련 이미지
  • (042520) HANS BIOMED CORPORATION IR: A Deep-Dive Fundamental Analysis & Investment Strategy

    (042520) HANS BIOMED CORPORATION IR: A Deep-Dive Fundamental Analysis & Investment Strategy

    The upcoming HANS BIOMED CORPORATION IR (Investor Relations) event on October 20, 2025, represents a critical crossroads for the company and its investors. With a market capitalization of 234.5 billion KRW, the company is navigating a period of significant financial turbulence. This deep-dive analysis will dissect the company’s current fundamentals, explore the potential outcomes of the IR event, and provide a clear investment strategy for stakeholders looking to make an informed decision.

    The Financial Storm: A Deep-Dive Fundamental Analysis

    A thorough HANS BIOMED fundamental analysis, based on its Q3 fiscal year 2025 report, reveals several significant red flags. These figures, detailed in the company’s Official Disclosure, paint a concerning picture that demands investor scrutiny.

    Key Areas of Concern:

    • Plummeting Sales: Consolidated sales have dropped by a sharp 18.58% year-over-year. The medical device segment, once a key driver, has been hit particularly hard by intensified overseas competition.
    • Deepening Losses: The company posted significant operating and net losses on a separate basis, signaling a severe deterioration in core profitability. While consolidated operating profit showed a slight positive, it’s likely a temporary reprieve against a backdrop of past losses.
    • Worsening Financial Health: The debt-to-equity ratio has climbed to a worrying 108.65%. The addition of new long-term borrowings raises serious questions about liquidity management and long-term financial stability.
    • R&D vs. Reality: While the company maintains a respectable R&D investment ratio, the challenge lies in execution. The success of its Chinese joint venture, ‘Revose’, is fraught with regulatory hurdles that could delay or derail future growth.

    This isn’t just a cyclical downturn; it’s a series of fundamental challenges that management must address head-on. The upcoming IR is their opportunity to present a credible turnaround plan or risk a further erosion of investor confidence.

    A Fork in the Road: Potential Scenarios from the IR Event

    The HANS BIOMED CORPORATION IR can be seen as a double-edged sword. The company’s presentation and subsequent Q&A will either restore faith or confirm investors’ worst fears.

    The Bull Case: A Path to Recovery

    A positive outcome hinges on management’s ability to present a detailed and believable strategy. This would involve a clear roadmap for boosting medical device sales, concrete plans for cost optimization, and a transparent strategy for managing debt. Highlighting the long-term potential of new ventures like ‘Revose’ and ‘ATEMZ’ with tangible progress updates could shift the narrative from crisis to opportunity, potentially stabilizing the HANS BIOMED stock.

    The Bear Case: Deepening Concerns

    Conversely, if the IR event is filled with vague promises and fails to address the core financial issues, it could trigger a significant sell-off. If the outlook presented falls short of market expectations or if answers to tough questions are evasive, it will deepen the perception of a company in decline. External pressures, such as currency fluctuations and market competition, which you can track via sources like Reuters Market Data, could amplify this negative sentiment.

    Your HANS BIOMED Investment Strategy

    Given the high stakes, a prudent and phased HANS BIOMED investment strategy is essential. Rushing into a decision before, during, or after the IR could be costly. For more background, you can review our guide on analyzing biotech stocks.

    Key Checkpoints for the IR:

    • Sales Turnaround: What is the specific, actionable plan to regain market share in medical devices?
    • Profitability Plan: How will the company control costs and improve margins without stifling necessary R&D?
    • Debt Management: What are the concrete steps to reduce the debt ratio and mitigate liquidity risks?
    • Growth Engine Feasibility: What is the realistic timeline and commercialization strategy for new ventures?

    Ultimately, investors should adopt a wait-and-see approach. Analyze the information presented during the IR with a critical eye, evaluate the feasibility of the proposed plans, and monitor the market’s reaction before committing capital. A long-term investment should only be considered if the company demonstrates a clear and credible path back to fundamental health.

    Frequently Asked Questions

    What are HANS BIOMED CORPORATION’s recent fundamentals?

    The company is facing significant headwinds, including declining sales, expanding net losses, deteriorating profitability, and a rising debt-to-equity ratio, raising concerns about its overall financial health.

    When is the HANS BIOMED CORPORATION IR event?

    The Investor Relations event is scheduled for October 20, 2025, at 9:00 AM. It will cover business status, outlook, and a Q&A session.

    What should investors focus on during this IR?

    Investors should focus on concrete strategies for sales recovery, cost structure improvements, debt management, and realistic commercialization timelines for new projects like China’s ‘Revose’.

    (042520) HANS BIOMED CORPORATION IR: A Deep-Dive Fundamental Analysis & Investment Strategy 관련 이미지
  • (484870) M&C Solution Stock: Why the National Pension Service Bet Big on this K-Defense Leader (2025 Analysis)

    (484870) M&C Solution Stock: Why the National Pension Service Bet Big on this K-Defense Leader (2025 Analysis)

    The investment community is buzzing with significant news: South Korea’s National Pension Service (NPS) has substantially increased its stake in M&C Solution, a pivotal player in the booming K-Defense industry, to 8.34%. When the nation’s largest institutional investor makes a move this decisive, it’s more than just a headline—it’s a powerful signal of profound confidence in a company’s future. This deep dive into M&C Solution stock will unpack the fundamentals, market dynamics, and strategic implications of this major investment.

    What makes M&C Solution so compelling to the NPS? In this analysis, we’ll explore the company’s stellar performance, the favorable tailwinds of the K-Defense sector, and what this all means for your investment portfolio. Let’s uncover the value proposition of M&C Solution and forecast the trajectory of K-Defense investments.

    The NPS Stamp of Approval: A Major Stake Increase

    On October 1, 2025, the National Pension Service officially reported its increased holding in M&C Solution. The public filing, available on DART, confirmed a significant boost in ownership from 6.16% to 8.34%, representing a 2.18 percentage point increase. You can view the Official Disclosure directly from the source.

    The stated purpose of this holding is ‘simple investment,’ which is crucial. It signifies that the NPS is not seeking managerial control but is instead making a long-term bet on the intrinsic value and growth potential of M&C Solution stock. This endorsement from a highly respected institutional investor often serves as a powerful catalyst, enhancing market confidence and attracting further investment.

    Unpacking the Explosive H1 2025 Financials

    The NPS’s decision is firmly rooted in M&C Solution’s exceptional financial performance. The first half of 2025 painted a picture of remarkable, multi-faceted growth that cannot be ignored.

    M&C Solution’s H1 2025 results aren’t just good; they’re a testament to operational excellence and strategic positioning within a high-growth sector. The triple-digit profit growth is a clear indicator of superior execution.

    Record-Breaking Revenue and Profitability

    The numbers speak for themselves. The company’s ability to scale both its top and bottom lines simultaneously is a key reason for the heightened investor interest in M&C Solution stock.

    • Half-year Revenue: Reached KRW 172.53 billion, a staggering 37.3% increase year-over-year (YoY).
    • Operating Profit: Skyrocketed to KRW 22.96 billion, marking an incredible 120.2% surge YoY.
    • Net Income: Grew to KRW 18.73 billion, an even more impressive 137.3% jump YoY.

    This profitability explosion was driven by robust demand from the defense sector and significant improvements in operational efficiency, particularly in managing selling, general, and administrative (SG&A) expenses.

    A Solid Financial Foundation

    While growth is vital, stability is paramount. M&C Solution has managed its expansion well, maintaining a healthy balance sheet. Total assets grew to KRW 404.44 billion, and a successful IPO has infused the company with capital for facility investments and future operations. While the debt-to-equity ratio saw a slight increase to 137.11%, it remains at a manageable level, especially when viewed in the context of its aggressive, well-funded growth strategy.

    Riding the Wave: The Golden Age of K-Defense

    M&C Solution’s success is not happening in a vacuum. It is a key beneficiary of the unprecedented boom in the K-Defense investment landscape. Several global factors are creating a fertile ground for growth:

    • Geopolitical Tensions: Escalating global conflicts have led nations worldwide to increase their defense budgets, creating a surge in demand for the high-quality, cost-effective solutions offered by South Korean firms. For more on this trend, see analysis from authoritative sources like Reuters on global defense spending.
    • Favorable Exchange Rates: A strong US Dollar and Euro against the Korean Won during H1 2025 provided a significant boost to the profitability of exports.
    • Market Recognition: The market has taken notice. The share price for M&C Solution stock has demonstrated phenomenal growth, and foreign ownership has steadily climbed from under 1% to nearly 9%, signaling strong international confidence.

    Investor Outlook & Strategic Action Plan

    The NPS investment solidifies M&C Solution’s position as a blue-chip K-Defense stock. However, prudent investors must consider both the opportunities and the risks.

    Short-Term and Long-Term Outlook

    In the short term, the NPS news is likely to provide strong support for the stock price, reinforcing positive sentiment. In the mid-to-long term, continued growth hinges on M&C Solution’s ability to maintain its performance trajectory and capitalize on the expanding K-Defense market. Further stake increases by institutional players could provide additional long-term tailwinds. To learn more about identifying such trends, you might find value in our guide to institutional investment strategies.

    Key Considerations and Potential Risks

    While the outlook is overwhelmingly positive, investors should remain vigilant:

    • Valuation Concerns: After a significant run-up, the stock’s valuation is high. Cautious investors should analyze future earnings forecasts before committing new capital.
    • Information Asymmetry: The defense industry is notoriously secretive. Detailed order information may be limited, requiring investors to trust in the management’s broader guidance.
    • Customer Concentration: A high reliance on a few major customers is a potential risk that needs continuous monitoring for signs of diversification.

    In conclusion, the National Pension Service’s increased stake in M&C Solution is a powerful validation of the company’s robust fundamentals and the immense potential of the K-Defense sector. For investors with a long-term horizon, M&C Solution stock represents a compelling opportunity to gain exposure to a high-growth industry leader, backed by one of the world’s most influential institutional investors.

    (484870) M&C Solution Stock: Why the National Pension Service Bet Big on this K-Defense Leader (2025 Analysis) 관련 이미지