Tag: Earnings Analysis

  • (067830) SAVEZONE I&C Corp. Q3 2025 Earnings: A Deep Dive Stock Analysis for Investors

    (067830) SAVEZONE I&C Corp. Q3 2025 Earnings: A Deep Dive Stock Analysis for Investors

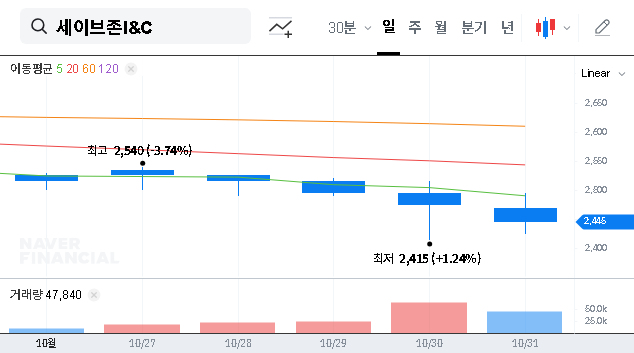
    This comprehensive analysis of the SAVEZONE I&C Corp. Q3 2025 earnings report unpacks the mixed signals sent to the market. While the headline figures reveal a sales slowdown and an operating loss, a surprising positive net income suggests a more complex story. For investors, understanding the nuances behind these numbers is paramount to assessing the company’s true value and future potential in a rapidly evolving retail landscape.

    We’ll explore the core challenges facing this offline retail veteran, from weakened consumer sentiment to fierce online competition, and evaluate the sustainability of its financial stability. Is this a temporary downturn or a sign of deeper structural issues? Let’s delve into the data to formulate a clear investor action plan.

    Breaking Down the SAVEZONE I&C Corp. Q3 2025 Earnings Report

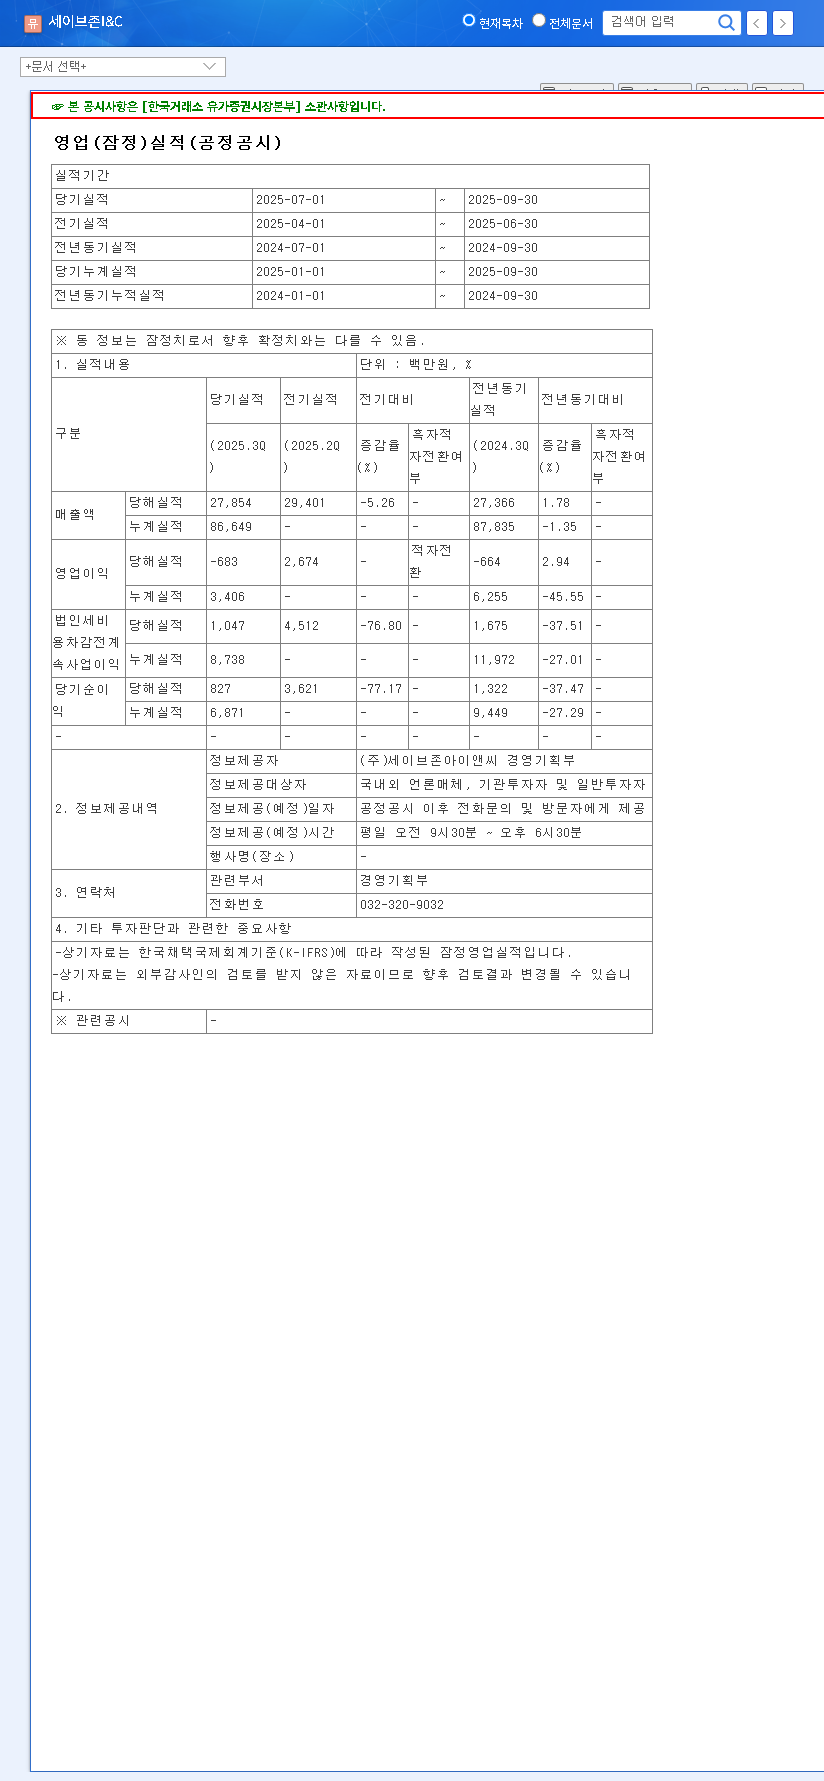
    The provisional Q3 2025 results for SAVEZONE I&C Corp. presented a challenging picture for its core operations. The decline from the previous quarter highlights escalating pressures on the business. Here are the key financial metrics, as detailed in the Official Disclosure (DART).

    Key Performance Indicators (Q3 2025)

    • Sales Revenue: KRW 27.9 Billion. This represents a 5.1% decrease from Q2, signaling a tangible impact from weakening consumer spending.
    • Operating Income: KRW -0.7 Billion. A significant reversal from the KRW 2.7 billion profit in Q2, this shift to an operating loss underscores deteriorating profitability in the core offline retail business.
    • Net Income: KRW 0.8 Billion. Despite the operating loss, the company remained profitable on a net basis. This paradox is key to understanding the current financial situation.

    Analysis: Why the Disconnect Between Operations and Net Profit?

    The divergence between a negative operating income and a positive net income can be attributed to several distinct factors—some cyclical, some structural, and some unique to SAVEZONE I&C’s financial management.

    1. Macroeconomic Headwinds and Online Competition

    The primary driver of the operational decline is the challenging market environment. Broad-based consumer sentiment has soured due to inflation and economic uncertainty, as reported by sources like global economic analysts. This disproportionately affects brick-and-mortar retailers like SAVEZONE I&C, particularly in discretionary spending categories like apparel and miscellaneous goods. Simultaneously, the relentless growth of e-commerce continues to siphon market share, putting immense pressure on pricing and margins.

    2. The Role of Non-Operating Income

    The positive net income is almost entirely due to non-operating activities. This includes items like valuation gains on financial assets (stocks, bonds, etc.) held by the company. While providing a temporary cushion, this type of income is volatile and not indicative of the core business’s health. Relying on market fluctuations rather than operational excellence is not a sustainable long-term strategy and can mask underlying weaknesses.

    While a stable balance sheet is commendable, the Q3 results signal an urgent need for business model innovation. The company’s future hinges on its ability to evolve beyond traditional retail, not just manage its investment portfolio.

    3. A Silver Lining: Financial Stability

    A significant positive for the SAVEZONE I&C Corp. stock is its robust financial structure. With a low debt-to-equity ratio of 18.54% (as of H1 2025), the company is not burdened by heavy interest payments and has the flexibility to navigate downturns or invest in strategic initiatives. Furthermore, a history of consistent cash dividends and an 8.18% holding of treasury shares demonstrate a commitment to enhancing shareholder value, which should not be overlooked.

    What’s Next? An Investor Action Plan

    Given the mixed signals from the SAVEZONE I&C Corp. Q3 2025 earnings, investors should adopt a cautious yet watchful approach. The immediate market reaction may be negative, but the company’s future trajectory depends on management’s response to these challenges.

    Key Strategic Imperatives for Management

    • Embrace an Omnichannel Strategy: The line between offline and online retail is gone. Integrating digital platforms with physical stores through services like ‘click-and-collect’ and ‘in-store returns for online orders’ is no longer optional; it’s essential for survival.
    • Aggressive Cost Optimization: A swift return to operating profitability requires a rigorous review of all operational costs. This includes supply chain efficiencies, store layout optimization, and energy management.
    • Differentiate the In-Store Experience: Physical stores must offer what e-commerce cannot: experience. This could mean exclusive in-store products, personalized customer service, or community events that transform stores into destinations.

    For investors, the key is to monitor whether the company takes decisive action in these areas. While the stock’s valuation may seem attractive after a potential price drop, it’s crucial to distinguish between a true value opportunity and a value trap. For more on this, read our guide on How to Value Retail Stocks in a Changing Market. Vigilance and a focus on fundamental business improvements will be the key to making an informed investment decision in the coming quarters.

    (067830) SAVEZONE I&C Corp. Q3 2025 Earnings: A Deep Dive Stock Analysis for Investors 관련 이미지
  • (063160) CKD Bio Corp. Q3 Earnings Shock: In-Depth Analysis for Investors on Revenue Decline & 2025 Stock Outlook

    (063160) CKD Bio Corp. Q3 Earnings Shock: In-Depth Analysis for Investors on Revenue Decline & 2025 Stock Outlook

    The latest CKD Bio Corp. Q3 earnings report for 2025 sent a shockwave through the investment community, revealing numbers that fell significantly short of market expectations. The preliminary results show a steep revenue decline and an alarming shift into operating and net losses, reversing the tentative positive signs from the first half of the year. This comprehensive CKD Bio Corp. analysis will dissect the report, explore the underlying causes, and provide a strategic outlook for current and potential investors weighing the future of their CKD Bio Corp. stock.

    A Deep Dive into the Q3 2025 Earnings Shock

    On October 31, 2025, CKD Bio Corp. released its preliminary third-quarter financial results, which painted a concerning picture of its current operational health. The figures, detailed in the Official Disclosure, confirmed a sharp downturn compared to the previous quarter.

    Key Financial Figures at a Glance:

    • Revenue: KRW 34.1 billion, a significant 17% decrease from Q2’s KRW 41.2 billion.
    • Operating Income: A loss of KRW -1.5 billion, a stark reversal into deficit territory.
    • Net Income: A net loss of KRW -2.2 billion, confirming the profitability challenges.

    This performance not only marks a severe decline in CKD Bio Corp. revenue but also erases the optimism generated by the H1 2025 report, which had hinted at a potential turnaround. The conversion to a net loss raises serious questions about the company’s cost structure and operational efficiency.

    Analyzing the Core Reasons for the Downturn

    The poor quarterly results stem from a combination of persistent internal weaknesses and mounting external pressures. Understanding these factors is crucial for any meaningful biotech stock analysis of CKD Bio Corp.

    Internal Headwinds: Fundamental Weaknesses Exposed

    • Weak API Segment: The Active Pharmaceutical Ingredients (API) division, a traditional revenue driver, continued its slump. Exports of antibiotic raw materials have been hit particularly hard by intensified global competition and reduced demand.
    • Struggling Health Food Segment: The health functional food market is increasingly saturated. CKD Bio Corp. has struggled to differentiate its offerings, leading to stagnant sales and margin erosion.
    • Inefficient Inventory Management: Rising inventory assets coupled with a declining turnover rate, a red flag noted in H1, clearly impacted Q3 performance by tying up capital and potentially leading to write-downs.

    External Pressures: A Challenging Macroeconomic Environment

    The company’s internal issues were exacerbated by a difficult global landscape. A widespread economic slowdown and persistent high-interest rates, as covered by institutions like Reuters, have suppressed consumer spending and increased corporate borrowing costs. Furthermore, significant exchange rate volatility, especially with the KRW against the USD and EUR, creates uncertainty and financial risk for an export-reliant company like CKD Bio Corp.

    The Q3 results highlight a perfect storm where internal operational inefficiencies collided with a harsh macroeconomic climate, leaving little room for error and exposing the company’s core vulnerabilities.

    Future Outlook & Strategic Action Plan for Investors

    In the short term, the CKD Bio Corp. Q3 earnings report will almost certainly weaken investor sentiment and apply downward pressure on the stock price. The key for long-term investors is to monitor how management responds. A proactive and transparent strategy is essential to regaining trust.

    Key Areas to Monitor:

    • Revenue Recovery Plan: Watch for concrete plans to revitalize the API and health food segments. This could include entering new markets, launching innovative products, or strategic partnerships.
    • Cost Control and Efficiency: The company must demonstrate a commitment to improving profitability through stricter SG&A expense management and optimizing its supply chain.
    • Botulinum Toxin Progress: This is the company’s most promising growth engine. Closely track milestones from the China Phase 3 clinical trials and progress on domestic commercialization. Tangible success here could be a major catalyst for the stock.
    • Financial Health: Keep an eye on the balance sheet and cash flow statements in the full Q3 report. For more context, you can read our guide to fundamental biotech stock analysis.

    Conclusion: A Crossroads for CKD Bio Corp.

    The disappointing CKD Bio Corp. Q3 earnings place the company at a critical juncture. The path forward depends on its ability to execute a convincing turnaround in its core businesses while successfully bringing its future growth drivers, like the Botulinum Toxin project, to market. For investors, this is a time for cautious observation and due diligence rather than reactive decisions. The company’s next steps will determine whether this quarter was a temporary setback or a sign of deeper, more systemic issues.

    (063160) CKD Bio Corp. Q3 Earnings Shock: In-Depth Analysis for Investors on Revenue Decline & 2025 Stock Outlook 관련 이미지
  • (004430) SONGWON INDUSTRIAL (004430) Earnings Analysis: Q3 2025 Turnaround & Future Outlook

    (004430) SONGWON INDUSTRIAL (004430) Earnings Analysis: Q3 2025 Turnaround & Future Outlook

    The latest SONGWON INDUSTRIAL earnings report for Q3 2025 has sent ripples through the investment community. After a challenging first half of the year, the company’s preliminary report shows a significant turnaround to profitability. While this news is a welcome sign of recovery, seasoned investors are asking the critical question: Is this a sustainable rebound or merely a temporary reprieve from deeper structural challenges? This comprehensive SONGWON INDUSTRIAL financial analysis will dissect the numbers, evaluate the underlying fundamentals, and provide a clear outlook on what lies ahead for ticker 004430.

    Dissecting the Q3 2025 SONGWON INDUSTRIAL Earnings Report

    On October 31, 2025, SONGWON INDUSTRIAL CO., LTD (004430) released its preliminary Q3 earnings, which marked a pivotal shift from the losses reported in Q1 and Q2. The key figures, as per the official disclosure, reveal a notable improvement in operational efficiency. (Source: Official DART Disclosure)

    • Revenue: KRW 258.6 billion
    • Operating Profit: KRW 5.4 billion (A significant turnaround to profitability)
    • Net Income: KRW 1.7 billion (Return to positive territory)

    This return to the black is primarily attributed to two factors: the reduced impact of one-time costs associated with ordinary wage provisions that heavily impacted Q2, and a modest recovery in demand for specific product lines. However, a slight quarter-over-quarter revenue decrease suggests that top-line growth remains a challenge.

    While the Q3 turnaround is a positive signal, it’s essential to look beyond the headline numbers. The core issue remains whether SONGWON has addressed the fundamental weaknesses that led to the earlier slump.

    In-Depth Analysis: Structural Strengths vs. Persistent Headwinds

    To truly understand the company’s trajectory, we must weigh the positive Q3 results against the persistent challenges identified in previous quarters and the broader market environment. The global chemical industry outlook remains complex.

    1. Profitability and Cost Structure Concerns

    The pressure on margins is a multi-faceted problem. While the one-time wage costs have subsided, the Supreme Court ruling has created a new, higher baseline for structural labor costs, which will continue to impact profitability. Furthermore, sluggish global demand, particularly in key markets, and geopolitical tensions have led to cautious purchasing behavior from customers, compressing margins. There’s a clear performance gap between SONGWON’s divisions: industrial chemicals like polymer stabilizers face intense competition and weak demand, while functional chemicals (TPU, SPU) are showing more resilience.

    2. Financial Health and Cash Flow Red Flags

    A look at the balance sheet reveals areas requiring diligent management. A high inventory-to-revenue ratio suggests that working capital is tied up and poses a risk of write-downs if demand doesn’t materialize. The year-on-year increase in interest-bearing debt is particularly concerning in a rising interest rate environment, as it leads to higher interest expenses that eat into net income. The negative operating cash flow seen in Q2, driven by lower profits and higher inventory, needs to be reversed. Investors will be keenly watching the full Q3 report to see if this trend has improved. Finally, a slowdown in capital expenditures could hinder the development of future growth drivers, a critical component for long-term competitiveness in the chemical sector.

    3. Macroeconomic and Competitive Landscape

    SONGWON does not operate in a vacuum. The broader economic climate presents significant risks. Lingering concerns over China’s economic slowdown and ongoing geopolitical instability, as noted by leading economic analysts, continue to suppress global demand for chemicals. Volatility in raw material prices (PHENOL, TBA, etc.) and major currency exchange rates (USD, EUR) directly impacts the company’s cost of goods sold and profitability. On the competitive front, the polymer stabilizer market is highly contested, while the push for eco-friendly PVC stabilizers adds R&D pressure. Moreover, the increasing presence of low-cost Chinese competitors in the functional chemicals space threatens market share and pricing power.

    Future Outlook & Investor Action Plan

    Given the mixed signals, a neutral, wait-and-see approach is prudent. The Q3 earnings provide a short-term positive catalyst and a potential bottom for the company’s performance. However, long-term, sustainable growth for SONGWON INDUSTRIAL hinges on its ability to execute on key strategic imperatives.

    Key Items for Investors to Monitor:

    • Q4 Earnings & 2026 Guidance: This will be the ultimate test of the recovery’s sustainability. Look for continued profitability and a positive outlook from management.
    • Margin Improvement: Monitor gross and operating margins to see if the company can effectively manage its cost structure and maintain pricing power.
    • Cash Flow Generation: Check for a return to positive operating cash flow, indicating efficient management of working capital, especially inventory.
    • Growth in Functional Chemicals: Track the performance of high-value segments like TPU/SPU, which are crucial for diversifying revenue and improving overall profitability.

    In conclusion, while the Q3 2025 SONGWON INDUSTRIAL earnings offer a glimmer of hope, the path ahead is fraught with challenges. Careful and continuous monitoring of the key financial and operational metrics listed above is essential before making any investment decisions.

    (004430) SONGWON INDUSTRIAL (004430) Earnings Analysis: Q3 2025 Turnaround & Future Outlook 관련 이미지
  • (138930) BNK Financial Group Inc. Stock: H1 2025 Earnings & Dividend Analysis

    (138930) BNK Financial Group Inc. Stock: H1 2025 Earnings & Dividend Analysis

    The latest H1 2025 earnings report for BNK Financial Group Inc. presents a complex narrative for investors. As a cornerstone of South Korea’s regional financial market, the group showcases impressive capital strength. However, this stability is contrasted by emerging challenges, including declining profitability amid shifting interest rate policies and fierce market competition. This comprehensive analysis will dissect the group’s performance, evaluate the strategic implications of its recent dividend announcement, and outline a prudent investment strategy for navigating the path ahead.

    H1 2025 Performance: A Tale of Two Realities

    In the first half of 2025, the financial results for BNK Financial Group Inc. painted a mixed picture. While the group’s capital foundation remains rock-solid, its core profitability metrics have faced headwinds. Let’s break down the key indicators that define this period.

    Key Financial Metrics

    • Capital Soundness: The consolidated BIS Capital Ratio stood at a robust 13.96%, significantly surpassing regulatory minimums and signaling excellent capital management and risk absorption capacity.
    • Interest Income Pressure: Net Interest Income (NII) saw a 2.3% year-on-year decline to KRW 1,443.9 billion. This was primarily driven by lower interest income from core deposit and loan activities, a direct reflection of a lower interest rate environment.
    • Profitability Metrics: Net profit attributable to controlling shareholders fell by 3.4% to KRW 475.8 billion. Consequently, Return on Assets (ROA) was 0.63%, and Return on Equity (ROE) was 8.97%.
    • Asset Quality: The group maintained stable asset quality, with a Non-Performing Loan (NPL) ratio of 1.62% and a delinquency ratio of 1.39%, indicating diligent risk management.

    Segment Performance Breakdown

    The performance varied significantly across the group’s subsidiaries. The banking segment, led by Busan Bank and Gyeongnam Bank, remains the profit engine, contributing 84.0% of the total. While Busan Bank delivered a solid KRW 251.7 billion in net profit, Gyeongnam Bank’s performance faltered, declining by KRW 45.8 billion to KRW 158.5 billion. The non-banking arms, including BNK Capital and BNK Savings Bank, also faced profitability slowdowns, though BNK Investment & Securities showed improvement.

    Drivers Behind the Slowdown & The Dividend Signal

    The performance of BNK Financial Group Inc. is not occurring in a vacuum. It is shaped by broad macroeconomic trends and specific company strategies. The downward pressure on profits is largely attributable to the external environment, including projected interest rate cuts in Korea, as discussed by financial analysts at reputable global news outlets. This trend directly squeezes the Net Interest Margin (NIM), the lifeblood of traditional banking.

    Despite these headwinds, the company’s commitment to shareholder returns remains unwavering, signaling confidence in its long-term financial stability and cash flow generation.

    On October 30, 2025, the board announced a Q3 cash dividend of KRW 120 per common share. This decision is a crucial piece of the group’s plan to achieve a shareholder return ratio exceeding 50% by 2027. This move is a clear, positive signal to the market about management’s focus on shareholder value. The official filing can be reviewed here: Official Disclosure (DART).

    Future Outlook: Strengths, Weaknesses, and Growth Drivers

    Looking ahead, investors should weigh the group’s inherent strengths against its pressing challenges. The future success of any BNK Financial Group Inc. investment strategy depends on the company’s ability to leverage its advantages while mitigating its risks.

    Positive Catalysts

    • Strong Capital Base: The high BIS ratio provides a formidable defense against economic shocks.
    • Digital Transformation: Ongoing investments in digital innovation and fintech partnerships are key to enhancing operational efficiency and long-term competitiveness.
    • Shareholder-Friendly Policies: The commitment to dividends and shareholder returns can attract and retain long-term investors.

    Concerns and Challenges

    • Profitability Squeeze: Continued pressure on NII requires a strategic pivot towards growing non-interest income streams.
    • Non-Banking Diversification: Improving the performance and diversifying the portfolios of non-banking subsidiaries like BNK Capital is critical for balanced growth.
    • Risk Management: Past disciplinary actions necessitate a continued focus on strengthening internal controls to ensure long-term stability and investor trust.

    Investment Thesis: A Neutral Stance with Key Monitors

    Given the balance of strong capital and profitability pressures, the current investment opinion for BNK Financial Group Inc. is ‘Neutral’. A cautious, observant approach is recommended. Investors should closely monitor several key performance indicators before adjusting their position. For a deeper dive into financial metrics, consider reading our guide on how to analyze banking stocks.

    Key Monitoring Points for Investors:

    • Quarterly changes in Net Interest Margin (NIM) and growth in non-interest income.
    • Profitability recovery in key subsidiaries, especially Gyeongnam Bank and BNK Capital.
    • Trends in asset quality metrics (NPL and delinquency rates).
    • Execution and sustainability of the announced shareholder return policy.

    In conclusion, while the quarterly dividend is an encouraging sign of management’s confidence, fundamental improvements in earnings power must follow. Investment decisions should be based on tangible progress in addressing the group’s strategic challenges.

    (138930) BNK Financial Group Inc. Stock: H1 2025 Earnings & Dividend Analysis 관련 이미지
  • (213500) Hansol Paper Q3 2025 Earnings Shock: Deep Dive Analysis & Investor Guide

    (213500) Hansol Paper Q3 2025 Earnings Shock: Deep Dive Analysis & Investor Guide

    The latest Hansol Paper Q3 2025 earnings report has sent ripples of concern through the market. The company’s preliminary operating results, announced on October 30, 2025, fell dramatically short of analyst expectations, marking an unexpected and jarring return to a deficit. For investors, this raises critical questions: What drove this significant underperformance? What are the immediate implications for Hansol Paper’s stock? And what is the most prudent path forward?

    This comprehensive analysis dissects the Hansol Paper financial results for the third quarter. We will explore the macroeconomic headwinds and industry-specific pressures that led to the downturn, evaluate the short- and long-term consequences, and provide a strategic action plan to help you navigate this volatile period and make well-informed investment decisions.

    Decoding the Numbers: The Hansol Paper Q3 2025 Earnings Miss

    The preliminary Q3 2025 figures were stark. Revenue came in at KRW 512.9 billion, a full 6% below the market consensus of KRW 548.1 billion. More alarmingly, the bottom line painted a grim picture. The company reported an operating loss of KRW -6.4 billion and a net loss of KRW -15.4 billion. These results represent a staggering miss compared to expectations, which had forecasted an operating profit of KRW 15.5 billion and a net income of KRW 7.5 billion—a deviation of 141% and 305%, respectively.

    This performance is especially troubling as it snaps a two-quarter streak of profitability, signaling a severe reversal of momentum and raising fundamental questions about the company’s stability in the current economic climate. The full details can be reviewed in the company’s filing. (Official Disclosure)

    What Caused the Underperformance?

    The disappointing Hansol Paper Q3 2025 earnings were not the result of a single factor, but rather a perfect storm of external pressures and internal challenges. We can categorize the primary causes into two key areas.

    Severe Macroeconomic Headwinds

    A challenging global economic environment created significant cost pressures for Hansol Paper. These factors are affecting industries worldwide but are particularly acute for manufacturing sectors reliant on global supply chains.

    • Surging Energy & Logistics Costs: A sustained rise in international oil prices over the last six months has directly inflated both manufacturing energy costs and transportation expenses, squeezing profit margins.
    • Adverse Exchange Rates: The appreciation of the KRW/USD exchange rate, hovering near 1,430 KRW, increases the cost of importing raw materials like pulp, a primary input for paper production.
    • High-Interest Rate Burden: Aggressive monetary tightening by central banks globally, including in the U.S. and Korea, has elevated the cost of capital and increased the financial burden of corporate debt.

    Pressures from Industry and Market Shifts

    Beyond the macro environment, the paper industry itself is navigating a period of intense change and competition. These paper industry challenges have directly impacted Hansol Paper’s revenue and profitability.

    • Intensified Competition: The printing and specialty paper markets are facing fierce competition, which limits pricing power and puts downward pressure on margins.
    • Weakening Demand: Economic slowdowns in key developed markets across North America and Europe have led to reduced demand for paper products, impacting sales volumes. For more on these global trends, see expert analysis from sources like Bloomberg.

    “The convergence of high input costs and softening demand creates a uniquely difficult environment for manufacturers. Companies that cannot adapt their cost structures or product portfolios quickly will face significant headwinds.”

    Implications and Future Outlook for Hansol Paper Stock

    This earnings shock necessitates a re-evaluation of the company’s trajectory. In the short term, the market’s reaction is likely to be negative. We can expect immediate downward pressure on Hansol Paper’s stock price as securities firms revise their earnings forecasts and target prices. Investor sentiment will likely weaken, and credit rating agencies may place the company on a negative watch if losses persist.

    Long-term, this period serves as a critical stress test. While Hansol Paper’s financial ratios have been healthy, a sustained period of unprofitability could raise concerns about its overall financial health and competitiveness. This performance may force management to undertake a comprehensive review of its business strategy, cost management processes, and portfolio of products to better align with the evolving market.

    Strategic Roadmap for Investors

    Given the uncertainty, a cautious and analytical approach is paramount. Here is a clear action plan for investors currently holding or considering a position in Hansol Paper:

    • Analyze Detailed Reports: Wait for the full, detailed earnings reports to understand the precise cost structure changes and which specific segments underperformed the most.
    • Monitor Financial Health: Keep a close eye on key financial indicators in the coming quarters, such as the debt-to-equity ratio, operating margins, and cash flow statements.
    • Watch for Strategic Shifts: Pay close attention to announcements from management regarding cost-cutting initiatives, plans to enter new growth areas, or changes to their long-term business strategy. This is a key part of any Hansol Paper stock analysis.
    • Benchmark Against Peers: Compare Hansol’s performance to its competitors. Is this an industry-wide crisis or a company-specific problem? See our analysis of the broader paper manufacturing sector for context.

    Ultimately, the market will be watching to see if Hansol Paper can turn this significant challenge into an opportunity for meaningful structural reform. How the company responds in the coming months will be critical in determining its future corporate value and stock performance.

    (213500) Hansol Paper Q3 2025 Earnings Shock: Deep Dive Analysis & Investor Guide 관련 이미지
  • (004020) HYUNDAI STEEL COMPANY Q3 2025 Earnings: Analysis, Outlook & Investor Guide

    (004020) HYUNDAI STEEL COMPANY Q3 2025 Earnings: Analysis, Outlook & Investor Guide

    The latest financial release from HYUNDAI STEEL COMPANY has sent ripples through the investment community. The Q3 2025 earnings report revealed figures that fell short of market expectations, sparking immediate concerns about the company’s short-term health. However, a deeper analysis suggests that beneath this temporary setback lies a foundation for significant long-term growth and strategic repositioning.

    This comprehensive guide will dissect the Hyundai Steel earnings for Q3 2025, explore the complex factors contributing to the results, and provide a clear-eyed view of the full-year outlook and the powerful growth drivers shaping its future. For investors, understanding this context is crucial for navigating the current volatility and making informed decisions about Hyundai Steel stock.

    Q3 2025 Earnings: The Numbers and The Shock

    HYUNDAI STEEL COMPANY announced its preliminary Q3 2025 results, which presented a mixed but ultimately disappointing picture when measured against market consensus. These figures, detailed in their Official Disclosure, require careful examination.

    • Revenue: Reached KRW 5,734.4 billion. While this marked a 1.95% year-on-year increase, it was -0.64% below the market’s expectation of KRW 5,771.5 billion.
    • Operating Profit: Showed a significant 80.97% year-on-year jump to KRW 93.2 billion, but still missed the consensus of KRW 102.9 billion by -9.43%.
    • Net Profit: The most significant deviation occurred here. The company turned profitable year-on-year with KRW 17.1 billion, but this was a staggering -55.47% below the market’s forecast of KRW 38.4 billion.

    The dramatic miss on net profit delivered a pronounced earnings shock, signaling deeper issues with profitability and cost management during the quarter.

    Factors Behind the Underperformance

    The Q3 earnings slump wasn’t caused by a single issue, but a convergence of challenging internal and external pressures. Understanding these headwinds is key to evaluating the steel market outlook and its impact on the company.

    Global and Macroeconomic Pressures

    A general economic slowdown across major global markets dampened demand for steel products, a trend exacerbated by anticipated cuts in China’s crude steel production. According to World Steel Association reports, this has created a challenging environment for all major producers. Furthermore, volatile raw material prices and an unfavorable USD/KRW exchange rate significantly increased import and logistics costs, squeezing profit margins.

    Strategic Investments and Segment Weakness

    A major contributor to the financial pressure is the ongoing construction of a new electric arc furnace in the United States. This strategic, long-term investment carries a substantial upfront cost burden that is currently impacting quarterly earnings. Compounding this, the company’s flat steel segment, a critical part of its business, experienced a sharp decline in profitability, which was the primary driver behind the significant net profit miss.

    While the Q3 2025 numbers are a cause for caution, they largely reflect short-term costs for long-term strategic gains. The real story lies in the company’s pivot towards high-value markets and sustainable technology.

    Full-Year Outlook and Long-Term Growth Engines

    Despite the quarterly setback, the forecast for HYUNDAI STEEL COMPANY for the full year 2025 and beyond contains several powerful catalysts for growth. This is where investors should focus their attention.

    Projected Rebound and Shareholder Value

    The full-year 2025 operating profit is projected to reach KRW 333.9 billion, with net profit at KRW 333.1 billion—a vast improvement over 2024. This optimism is based on an expected recovery in the steel market and the initial benefits from new investments beginning to materialize. Expected Earnings Per Share (EPS) of KRW 3,776 and Book Value Per Share (BPS) of KRW 69,600 signal a strong potential for enhanced shareholder value.

    Strategic Growth Initiatives

    • North American Foothold: The new U.S. electric arc furnace is more than just a factory; it’s a strategic entry into the lucrative North American market, positioning the company to benefit from trends in reshoring and demand for locally sourced materials.
    • High-Value Product Mix: A focus on expanding sales of premium products like low-carbon steel for green construction and ultra-high-strength plates for the electric vehicle (EV) industry will secure higher margins and new growth engines.
    • Future-Proof Technology: Investments in next-generation tech, such as hydrogen reduction steelmaking, are vital for long-term competitiveness and meeting increasingly stringent environmental regulations.
    • ESG Leadership: Strong Environmental, Social, and Governance (ESG) performance, highlighted by accolades like the CDP ‘Carbon Management Sector Honors’, enhances corporate value and attracts a modern class of investors.

    Investor Action Plan: A Long-Term Perspective

    Given the disappointing Hyundai Steel Q3 2025 results, a knee-jerk reaction might be to sell. However, a more prudent approach involves looking past the immediate noise. Investors should consider the full picture by focusing on the company’s long-term trajectory and fundamental strengths, which you can compare with our comprehensive analysis of the 2025 steel industry trends.

    The key is to weigh the current downside risks against the substantial long-term growth potential. Closely monitor progress on the North American expansion, the adoption rate of high-value products, and the broader macroeconomic environment. While short-term volatility is likely, the strategic initiatives underway at HYUNDAI STEEL COMPANY could position it for significant success in the years to come.

    (004020) HYUNDAI STEEL COMPANY Q3 2025 Earnings: Analysis, Outlook & Investor Guide 관련 이미지
  • (236200) Suprema Inc. Earnings Analysis (Q3 2025): A Deep Dive for Investors in AI Security

    (236200) Suprema Inc. Earnings Analysis (Q3 2025): A Deep Dive for Investors in AI Security

    The latest Suprema Inc. earnings report for Q3 2025, released on October 30, has sent ripples through the investment community. With both revenue and operating profit falling slightly short of market consensus, questions have emerged: Is this a momentary hiccup for the AI security solutions giant, or does it signal a more fundamental challenge? While short-term market sentiment may be swayed by these figures, a deeper analysis reveals a company strategically positioning itself for long-term dominance through its advanced biometric technology and expanding global footprint. This article provides a comprehensive investor analysis, looking beyond the headlines to assess Suprema’s core strengths, current headwinds, and future trajectory.

    Deconstructing the Q3 2025 Suprema Inc. Earnings Miss

    Suprema Inc. (KOSDAQ: 236200) announced its preliminary consolidated financial results for the third quarter of 2025, which came in below market forecasts. For a detailed breakdown, investors can review the Official Disclosure (DART). Here’s a summary of the key performance indicators:

    • Revenue: KRW 30.3 billion, which was 4% below the forecasted KRW 31.4 billion.
    • Operating Profit: KRW 6.5 billion, representing an 8% miss compared to the forecasted KRW 7.1 billion.
    • Net Profit: KRW 10.6 billion (a consensus forecast was not widely available).

    This underperformance, particularly when compared to the prior quarter, has understandably led to short-term pressure on the Suprema Inc. stock price. To understand the full picture, we must analyze the contributing factors.

    While the Q3 numbers reflect current market challenges, Suprema’s continued investment in AI and its established global leadership provide a solid foundation for future growth and value creation.

    Key Factors Behind the Performance Dip

    The Q3 results were not caused by a single issue, but rather a confluence of external pressures and internal strategic investments. These challenges are being felt across the technology sector, as noted by industry analysts at firms like Gartner.

    1. Macroeconomic Headwinds and Currency Fluctuations

    The persistent high interest rates in the U.S. and Europe are signaling a potential global economic slowdown. This environment often leads to corporations delaying capital expenditures and new security infrastructure projects, directly impacting Suprema’s sales cycle. Furthermore, as a major exporter, the company faced an unfavorable exchange rate environment, which squeezed margins on international sales.

    2. Intensifying Market Competition

    The biometric and physical security markets are evolving rapidly. Aggressive pricing strategies from emerging competitors, particularly from China, have increased pressure on established players. While Suprema competes on technological superiority, this heightened competition can impact short-term profitability. This dynamic underscores the importance of continuous innovation, which leads to the next point.

    3. Strategic R&D Investment in AI Security Solutions

    To maintain its leadership, Suprema continues to invest heavily in Research & Development. This focus on next-generation AI security solutions and advanced biometric technology is a strategic necessity, not a discretionary cost. While these investments weigh on current operating profits, they are crucial for building a competitive moat and securing future high-margin revenue streams.

    The Long-Term Outlook: Why Fundamentals Remain Strong

    Despite the short-term noise, Suprema’s fundamental growth story remains intact, powered by its technological edge and market position. For more on this topic, see our guide to understanding growth stocks in the tech sector.

    • Pioneering AI Integration: Suprema is embedding AI across its entire product portfolio. This includes AI-powered fingerprint recognition that prevents spoofing, intelligent video surveillance cameras with behavioral analytics, and integrated control platforms that offer predictive security insights.
    • Dominant Global Market Share: With a commanding presence in Europe, the Middle East, and Africa (EMEA) and a robust strategy for North American expansion, Suprema’s global reach is a key asset. Its network of over 1,000 clients in 100+ countries provides a stable, diversified revenue base.
    • Operational Synergies: The recent merger with a key subsidiary is set to streamline operations, reduce overhead, and enhance management efficiency, which should positively impact margins in the coming quarters.
    • Solid Financial Health: Even with the recent miss, the company maintains a healthy balance sheet and consistent profitability, giving it the resilience to navigate economic downturns and continue its strategic investments.

    Investor Action Plan and Forward Look

    Given the current landscape, a measured and long-term perspective is crucial for any Suprema Inc. stock investor. While short-term volatility is likely, the company’s long-term potential remains compelling.

    Key Areas to Monitor:

    • AI Product Adoption: Track the market uptake and revenue contribution of new AI-powered solutions, especially the Video Management System (VMS) and intelligent cameras.
    • Margin Stabilization: Observe future earnings reports for signs of stabilizing operating margins as the company navigates competitive pressures and realizes merger-related efficiencies.
    • Geographic Expansion: Look for tangible progress and key wins in the North American market, which represents a significant growth opportunity.

    In conclusion, while the Q3 2025 Suprema Inc. earnings report presented a short-term challenge, it does not derail the company’s powerful long-term narrative. For investors with a patient, forward-looking approach, the current market sentiment may present an opportunity to engage with a leader in the high-growth AI security solutions market at a more attractive valuation.

    (236200) Suprema Inc. Earnings Analysis (Q3 2025): A Deep Dive for Investors in AI Security 관련 이미지
  • (005930) Samsung Electronics Q3 2025 Dividend: Complete Investor Analysis & Stock Outlook

    (005930) Samsung Electronics Q3 2025 Dividend: Complete Investor Analysis & Stock Outlook

    The recent Samsung Electronics Q3 2025 Dividend announcement has captured the attention of investors globally. While the commitment to consistent Samsung shareholder return is a welcome sign of stability, it arrives amidst a backdrop of declining operating profits revealed in the latest semi-annual report. This creates a complex picture for current and prospective shareholders. Does this dividend signal underlying financial strength, or does it mask deeper performance challenges?

    This comprehensive guide provides a detailed Samsung stock analysis, dissecting the Q3 2025 dividend decision, evaluating the company’s recent performance, and forecasting the potential impact on its stock price and long-term corporate value. We will equip you with the insights needed to make informed investment decisions regarding one of the world’s leading technology giants.

    Official Q3 2025 Dividend Announcement Details

    Samsung Electronics has reaffirmed its dedication to shareholder returns with the formal declaration of its quarterly cash dividend. The official announcement, filed and available for public review, provides the following key details. You can view the full report here: Official Disclosure.

    • Dividend Amount: KRW 370 per common share (0.4% yield) & KRW 370 per preferred share (0.6% yield).
    • Record Date: September 30, 2025.
    • Payment Date: November 19, 2025.
    • Announcement Date: October 30, 2025.

    Performance Deep Dive: A Tale of Two Metrics

    To understand the context of the Samsung Electronics Q3 2025 Dividend, we must analyze the company’s performance in the first half of 2025. While revenue grew to KRW 153.71 trillion, operating profit fell to KRW 11.36 trillion, painting a mixed but concerning picture.

    The Semiconductor Headwind

    The primary driver of the profit decline is the Device Solutions (DS) division, the heart of Samsung’s semiconductor business. This segment is facing significant headwinds from a cyclical downturn in memory chip prices and fierce global competition. The volatility of the semiconductor market, a topic frequently covered by authoritative sources like Reuters, directly impacts Samsung’s bottom line. While the Device eXperience (DX) division, which includes mobile phones and TVs, maintained its market leadership, it couldn’t fully offset the DS division’s struggles.

    Underlying Strengths and Core Fundamentals

    Despite these challenges, Samsung’s foundations remain strong. The company’s massive operating cash flow of KRW 33.94 trillion provides substantial financial flexibility. Furthermore, its market dominance in consumer electronics is undisputed, and strategic integration of AI technology into its products is enhancing future competitiveness. In semiconductors, its technological leadership in advanced processes and expansion into high-growth areas like automotive chips represent significant long-term opportunities. For a broader view, you can read our complete 2025 semiconductor market analysis.

    The dividend decision is less about celebrating current profits and more about signaling confidence in long-term cash generation and a steadfast commitment to shareholder value.

    Impact on Stock Price and Investor Outlook

    The dividend acts as a stabilizing force. In the short term, it can bolster investor sentiment and provide a floor for the stock price by highlighting the reliable Samsung shareholder return policy. However, long-term valuation will be dictated by a recovery in Samsung earnings and its ability to navigate the competitive landscape.

    Given the current operating profit trend, a significant, dividend-driven stock rally is unlikely. Instead, investors should view this as a component of a larger picture. The minimal impact on Samsung’s vast cash reserves means the dividend is sustainable, but the market will be looking for more fundamental catalysts for growth.

    Investment Thesis and Key Factors to Watch

    Our investment opinion remains Neutral. The dividend confirms financial stability, but the headwinds in the core semiconductor business warrant caution. The future trajectory of Samsung’s stock will depend heavily on the following factors:

    • Semiconductor Market Recovery: The timing and strength of the rebound in memory chip demand and pricing are the most critical catalysts.
    • AI and New Growth Ventures: Tangible progress and revenue from AI-related technologies, advanced foundry services, and automotive semiconductors.
    • Global Macroeconomic Conditions: Geopolitical tensions, trade policies, and global consumer demand will continue to influence performance.

    Investors should closely monitor Samsung’s quarterly earnings reports and industry-wide indicators to make strategic decisions. While the dividend provides a measure of security, the real growth story lies in the company’s ability to innovate and execute through the current industry cycle.

    Frequently Asked Questions (FAQ)

    Q: How was SAMSUNG ELECTRONICS’ performance in the first half of 2025?

    A: In H1 2025, revenue increased year-over-year, but operating profit saw a significant decrease. This decline is primarily attributed to the challenging conditions in the semiconductor market affecting the Device Solutions (DS) division.

    Q: What is the primary impact of this dividend decision on Samsung’s stock?

    A: In the short term, it positively reinforces investor confidence and demonstrates a commitment to shareholder returns. However, long-term stock performance is more dependent on fundamental earnings improvement and growth prospects rather than the dividend itself.

    Q: What should investors monitor when considering an investment in Samsung?

    A: Beyond the dividend, investors should carefully track the recovery of the semiconductor market, tangible results from new growth areas like AI, and shifts in the global macroeconomic and geopolitical landscape to make well-informed decisions.

    (005930) Samsung Electronics Q3 2025 Dividend: Complete Investor Analysis & Stock Outlook 관련 이미지
  • (000660) SK hynix HBM & Earnings Analysis (H1 2025): Dominating the AI Semiconductor Market

    (000660) SK hynix HBM & Earnings Analysis (H1 2025): Dominating the AI Semiconductor Market

    The first half of 2025 has solidified SK hynix’s position as a titan in the global AI semiconductor market, driven by its unprecedented success in High Bandwidth Memory (HBM). As artificial intelligence continues to reshape every industry, the demand for powerful, specialized memory has exploded. This detailed analysis unpacks the company’s record-breaking performance, its technological supremacy in SK hynix HBM, its robust financial health, and the strategic roadmap that positions it as a key beneficiary of the AI revolution.

    This report provides a comprehensive look at the SK hynix earnings for H1 2025, offering critical insights for investors monitoring the semiconductor sector’s future trajectory. We will explore the key growth engines, potential risks, and why SK hynix continues to be a compelling investment opportunity.

    The Engine of AI: Unpacking SK hynix HBM Dominance

    The cornerstone of SK hynix’s recent success is its unparalleled leadership in the High Bandwidth Memory space. HBM is a specialized type of DRAM that stacks memory chips vertically, enabling significantly higher bandwidth and lower power consumption compared to traditional memory. This architecture is essential for the massive parallel processing required by AI accelerators and GPUs from companies like NVIDIA.

    SK hynix has cemented its leadership by being the world’s first to mass-produce HBM3E, the latest generation of this critical technology. Furthermore, its official announcement of developing 16-layer HBM3E technology signals a clear commitment to staying ahead of the curve. This technological moat is the company’s most formidable competitive advantage and the primary driver behind its stellar performance in the AI semiconductor market.

    H1 2025 SK hynix Earnings: A Financial Deep Dive

    Record-Breaking Revenue and Profitability

    In the first half of 2025, SK hynix reported its highest-ever revenue and operating profit. The second quarter was particularly impressive, with an operating profit margin reaching a remarkable 41%. This showcases the company’s ability to not only capture market share but also enhance profitability through a strategic focus on high-value products like SK hynix HBM and improved cost efficiencies across its operations. For a detailed breakdown, please refer to the company’s Official Disclosure (Source: DART).

    A Fortress Balance Sheet

    The company’s financial health has shown significant improvement. As of H1 2025, the consolidated debt-to-equity ratio stood at a healthy 48.13%, with a net debt-to-equity ratio of just 5.60%. These figures underscore a stable and resilient financial structure, even in a climate of economic uncertainty. With liquid assets totaling 45.2 trillion KRW, SK hynix is well-positioned to execute its investment plans and manage short-term obligations without strain. A massive 11.2 trillion KRW investment in tangible assets, primarily for expanding HBM production capacity, highlights its aggressive strategy to lead the AI memory market for years to come.

    SK hynix’s commitment to a fixed dividend of 1,500 KRW per share from 2025-2027, plus potential FCF-based returns, provides a strong signal of confidence in sustained profitability and shareholder value enhancement.

    Market Dynamics: DRAM and NAND Analysis

    The DRAM Market Analysis: Resurgence Fueled by AI

    The overall DRAM market analysis reveals a strong recovery. Increased AI workloads in data centers and the adoption of AI-enabled PCs have propelled both shipment volumes and Average Selling Prices (ASP) for high-performance DRAM. This trend, led by the insatiable demand for HBM, is expected to continue as the AI ecosystem expands.

    Navigating Competition in the NAND Market

    The NAND segment presents a more complex picture. While shipment volumes surged by over 70% year-on-year, indicating a broad demand recovery, ASPs saw a slight dip. This is attributed to intense competition and pricing pressure on solution products like eSSDs. SK hynix’s strategy here is to focus on high-value, high-capacity products and leverage its technology roadmap, including its next-generation 321-layer 4D NAND, to improve profitability.

    Charting the Future: Technology Roadmap & Strategic Vision

    Beyond HBM, SK hynix is proactively shaping the future of memory. The company is strengthening its next-gen portfolio with technologies like 1cnm LPDDR5X for mobile devices and preparing to lead the emerging CXL (Compute Express Link) memory market, which promises to revolutionize server architecture. For a deeper dive into these technologies, you can explore resources from industry experts like AnandTech’s memory deep dives. This forward-looking approach is crucial for maintaining long-term growth. Furthermore, our own guide on Understanding High Bandwidth Memory can provide additional context.

    Investment Thesis: Opportunities & Risks

    Positive Investment Drivers

    • Unrivaled HBM Leadership: Dominant position in the fastest-growing segment of the memory market.
    • Strong DRAM Market Recovery: Benefiting from rising ASPs and demand from AI data centers and PCs.
    • Solid Financials: Improved balance sheet and a shareholder-friendly return policy.
    • Future-Proof Tech Pipeline: Strategic investments in next-generation memory like CXL and advanced NAND.

    Potential Risks and Considerations

    • NAND Market Headwinds: Continued price pressure and competition could impact overall profitability.
    • Macroeconomic Volatility: Global economic slowdowns and geopolitical risks remain a persistent threat.
    • Currency Fluctuations: While a strong USD is beneficial, weakness in the JPY and EUR could pose FX risks.
    • Industry Cyclicality: The semiconductor industry is inherently cyclical, requiring careful inventory and supply chain management.

    Investment Opinion: Buy. SK hynix Inc. demonstrates powerful fundamentals and a clear growth trajectory as a primary beneficiary of the AI era. Its technological supremacy in the HBM market provides a durable competitive advantage, justifying a positive outlook. Investors should, however, remain vigilant of macroeconomic factors and market volatility.

    (000660) SK hynix HBM & Earnings Analysis (H1 2025): Dominating the AI Semiconductor Market 관련 이미지
  • (316140) Woori Financial Group Q3 2025 Earnings Analysis: Profit Beat & Investor Outlook

    (316140) Woori Financial Group Q3 2025 Earnings Analysis: Profit Beat & Investor Outlook

    Woori Financial Group Inc. (KRX: 316140) has released its preliminary financial results, and the initial numbers from the Woori Financial Group Q3 2025 earnings report present a complex puzzle for investors. While the group’s operating profit fell short of market consensus, its net profit surprisingly surpassed expectations. This mixed signal raises critical questions about the company’s underlying financial health and future trajectory.

    This comprehensive analysis dissects the official earnings data, explores the fundamental drivers behind the numbers, and evaluates the broader macroeconomic headwinds impacting the Korean financial sector. We provide a forward-looking perspective on what this performance means for Woori Financial Group stock and offer strategic insights for current and prospective investors.

    Q3 2025 Earnings at a Glance

    According to the company’s preliminary consolidated results for the third quarter of 2025, Woori Financial Group reported a revenue of KRW 8,000.9 billion, an operating profit of KRW 987.7 billion, and a controlling net profit of KRW 1,244.4 billion. The full details can be reviewed in the Official Disclosure (DART).

    • Operating Profit Miss: The operating profit of KRW 987.7 billion was a significant 17% below the market’s expectation of KRW 1,194.9 billion. This decline, both quarter-over-quarter and year-over-year, points to escalating competition and potential pressures on core profitability.
    • Net Profit Beat: Conversely, the net profit of KRW 1,244.4 billion impressively exceeded consensus estimates (KRW 1,047.4 billion) by 19%. However, this outperformance appears to be driven by non-operating factors, such as one-off gains from asset sales or favorable tax adjustments, rather than a fundamental improvement in core business operations.

    Behind the Numbers: Fundamentals vs. Macro Environment

    To truly understand the Woori Financial Group Q3 2025 earnings, we must look beyond the headline figures and analyze the two primary forces at play: the company’s internal strategic initiatives and the external economic climate.

    Strengthening the Integrated Financial Powerhouse

    Despite short-term profit fluctuations, Woori Financial Group is making strategic moves to solidify its long-term market position.

    The group’s focus on diversifying revenue streams beyond traditional banking is a key pillar of its future growth strategy, aiming to build resilience against interest rate volatility.

    • Non-Banking Expansion: The full-scale operation of Woori Investment & Securities and the integration of a life insurance subsidiary are critical steps. These ventures are designed to increase stable, non-interest income from fees and commissions, reducing dependency on net interest margins.
    • Robust Financial Health: The group maintains a strong capital position with a CET1 ratio above 12.8% and a managed Non-Performing Loan (NPL) ratio of 0.71%. This demonstrates a solid foundation to weather economic uncertainties.
    • ESG Leadership: Achieving top-tier ESG ratings (MSCI ‘AAA’, DJSI inclusion) is no longer just a reputational benefit. It attracts a growing class of global investors and can lead to a lower cost of capital, enhancing long-term corporate value.

    Navigating Macroeconomic Headwinds

    The global economic landscape remains a significant challenge. According to global economic reports from outlets like Bloomberg, several factors are creating a difficult operating environment for financial institutions.

    • Persistent Interest Rates: While the Bank of Korea’s stable policy rate provides some predictability, rising funding costs across the board are squeezing net interest margins (NIM), a core profitability metric for banks.
    • Economic Uncertainty: Downside risks, including geopolitical tensions, a slowdown in domestic growth, and concerns over the real estate market (particularly Project Financing loans), continue to create volatility and require prudent risk management.
    • Market Volatility: Fluctuations in the KRW/USD exchange rate and commodity prices add another layer of complexity, affecting overseas operations and the value of foreign currency-denominated assets.

    Investor Outlook & Strategic Action Plan

    The market’s reaction to the Woori Financial Group analysis will likely be mixed. The operating profit miss could trigger short-term negative sentiment, as investors question the quality of the net profit beat. However, a long-term view reveals a more optimistic picture centered on the group’s strategic transformation.

    The key determinant of future stock performance will be the tangible results from the non-banking segments. Investors should monitor for clear evidence of synergy and profit growth from the securities and insurance arms. For those looking to broaden their portfolio, our guide on investing in leading Korean financial stocks provides valuable context.

    In conclusion, while the Q3 2025 results were clouded by one-off factors and macroeconomic pressures, Woori Financial Group’s foundational strengthening and diversification strategy remain intact. Prudent investors will look past the short-term noise, focusing on the execution of its long-term vision for sustainable, diversified growth.

    Frequently Asked Questions (FAQ)

    Q1: What were the key takeaways from Woori Financial Group’s Q3 2025 earnings?

    A1: The main story was a mixed result. Operating profit fell 17% below market expectations, indicating pressure on core banking operations. However, net profit beat expectations by 19%, largely due to non-recurring gains rather than fundamental business improvement.

    Q2: Why is the distinction between operating and net profit important here?

    A2: Operating profit reflects the health of a company’s primary business activities. Net profit includes all income and expenses, including one-off events like asset sales. A miss in operating profit suggests the core business is facing challenges, even if the final net profit looks strong.

    Q3: What are the long-term growth drivers for Woori Financial Group?

    A3: The key long-term drivers are the expansion of its non-banking divisions (securities, insurance, wealth management), which will create more diverse and stable revenue streams. Its strong financial health and leadership in ESG are also major long-term attractions for investors.

    Q4: What should investors watch for in the coming quarters?

    A4: Investors should monitor the growth of non-interest income, the profitability of the new securities and insurance subsidiaries, and the company’s ability to manage costs and credit risks, especially concerning real estate loans. Progress in digital transformation will also be a key indicator of future competitiveness.

    Disclaimer: This analysis is based on preliminary data and publicly available information. It does not constitute investment advice. Investors should conduct their own due diligence before making any investment decisions.

    (316140) Woori Financial Group Q3 2025 Earnings Analysis: Profit Beat & Investor Outlook 관련 이미지