Tag: Earnings Analysis

  • (126600) BGFecomaterials Q3 2025 Earnings: In-Depth Analysis of Profitability & Stock Outlook

    (126600) BGFecomaterials Q3 2025 Earnings: In-Depth Analysis of Profitability & Stock Outlook

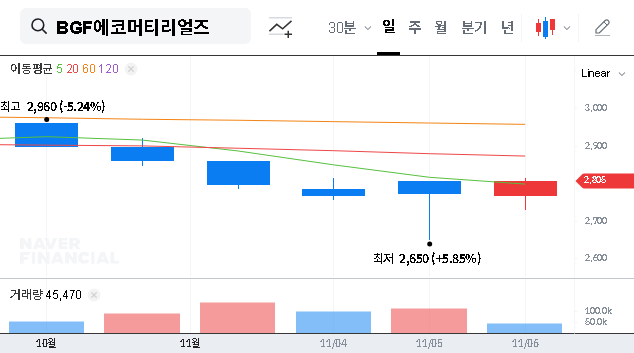
    The latest BGFecomaterials Q3 2025 earnings report has captured the attention of the market, signaling a significant rebound in profitability after a challenging first half of the year. For investors tracking BGFecomaterials CO., LTD. (126600), these provisional results present a critical question: Is this the start of a sustained recovery, or a temporary bright spot in a volatile market? This in-depth analysis will dissect the Q3 figures, explore the underlying business segments, evaluate the macroeconomic environment, and provide a strategic outlook for potential investors.

    BGFecomaterials Q3 2025 Earnings at a Glance

    On November 6, 2025, BGFecomaterials disclosed its provisional consolidated operating results for the third quarter. The headline numbers showcase a business navigating a complex economic landscape with newfound efficiency. The official filing can be reviewed directly for verification. (Source: Official DART Disclosure)

    • Revenue: KRW 100.8 billion
    • Operating Profit: KRW 5.8 billion
    • Net Income: KRW 5.3 billion

    While revenue experienced a slight dip from Q2, the dramatic improvement in net income compared to the previous quarter (KRW 1.9 billion) is the key takeaway, suggesting a significant positive shift in the company’s operational leverage and cost management.

    Deep Dive: Unpacking the Performance

    A Welcome Rebound in BGFecomaterials’ Profitability

    The core story of the BGFecomaterials Q3 2025 earnings is the robust recovery in its bottom line. This improvement likely stems from a combination of factors, including successful cost-cutting initiatives, a more favorable product mix tilted towards high-margin items like semiconductor materials, and easing prices for certain raw materials. This trend suggests that management’s strategic adjustments are beginning to yield tangible financial results.

    Quarter-over-Quarter Financial Trend (Unit: KRW Billion)

    • 2024.4Q: Revenue 98.0, Operating Profit 1.5, Net Income 5.4
    • 2025.1Q: Revenue 99.0, Operating Profit 4.8, Net Income 2.8
    • 2025.2Q: Revenue 103.7, Operating Profit 6.1, Net Income 1.9
    • 2025.3Q: Revenue 100.8, Operating Profit 5.8, Net Income 5.3

    The Q3 results indicate a pivotal shift from revenue preservation to profitability enhancement. This strategic focus is crucial for building long-term shareholder value in a challenging global market.

    Analyzing the Macroeconomic Landscape

    No company operates in a vacuum. BGFecomaterials’ performance was influenced by a complex global environment in Q3. Volatile KRW/USD and KRW/EUR exchange rates likely created both challenges for import costs and opportunities for export revenue. Meanwhile, stable benchmark interest rates in the US (4.50%) and Korea (2.50%) provided a predictable backdrop for financing. However, persistent high logistics costs, as indicated by the Baltic Dry Index, and volatile oil prices remain a significant factor for a materials-based company. For broader context, you can track global economic indicators on authoritative platforms like Reuters.

    Strategic Outlook & Investor Action Plan

    Considering the BGFecomaterials investment case requires balancing the recent positive momentum with ongoing market risks. The Q3 results offer compelling reasons for optimism but also highlight areas that demand continued scrutiny.

    The Bull Case: Reasons for Optimism

    • Proven Efficiency: The profitability rebound demonstrates management’s ability to effectively control costs and optimize operations.
    • Growth-Segment Strength: Robust performance in high-value sectors like semiconductor and automotive materials could drive future growth.
    • Market Stabilization: While revenue dipped slightly, its relative stability suggests the company is finding its footing in the current market.

    The Bear Case: Potential Risks & Headwinds

    • Macroeconomic Uncertainty: A global economic slowdown, high interest rates, and currency fluctuations remain significant threats.
    • Intense Competition: The materials industry is highly competitive, which could pressure margins over the long term.
    • Subsidiary Risk: Investors should monitor potential risks related to subsidiaries, such as the auditor designation for K&W Co., Ltd. For more background, see our previous analysis of BGFecomaterials’ corporate structure.

    In conclusion, the BGFecomaterials Q3 2025 earnings report marks a potential turning point. While the positive shift in profitability provides a solid foundation for short-term positive sentiment, long-term investors should adopt a cautious approach, closely monitoring the sustainability of these gains against the backdrop of a fluid global economy.

    (126600) BGFecomaterials Q3 2025 Earnings: In-Depth Analysis of Profitability & Stock Outlook 관련 이미지
  • (049960) CELL BIOTECH Q3 2025 Earnings Analysis: Deep Dive into Probiotic Growth & Oncology Pipeline

    (049960) CELL BIOTECH Q3 2025 Earnings Analysis: Deep Dive into Probiotic Growth & Oncology Pipeline

    This comprehensive CELL BIOTECH Q3 2025 earnings analysis provides investors with a critical look into the company’s latest performance. As a powerhouse in the probiotics market and a rising innovator in biotechnology with its development of new oncology drugs, CELL BIOTECH’s quarterly reports are a key indicator of its trajectory. We will dissect the financials, evaluate the strength of its core business, and project the potential of its future growth drivers.

    Is the company’s recent performance a sign of sustained momentum, or are there underlying challenges investors should note? Let’s explore the data and what it means for the future of CELL BIOTECH.

    CELL BIOTECH’s Q3 2025 Earnings Report: The Key Figures

    On November 6, 2025, CELL BIOTECH released its consolidated provisional earnings, offering a clear snapshot of its operational health. The quarter-over-quarter improvements signal a positive recovery and strengthening business fundamentals.

    • Revenue: 15.4 billion KRW (A notable increase from 11.9 billion KRW in Q2 2025)
    • Operating Profit: 2.2 billion KRW (Up significantly from 1.3 billion KRW in Q2 2025)
    • Net Income: 3.4 billion KRW (A dramatic improvement from 0.2 billion KRW in Q2 2025)

    These figures, particularly the sharp rise in net income, highlight not only core business recovery but also effective financial management. For a complete breakdown, refer to the Official Disclosure (DART).

    Fundamental Strengths: The Twin Pillars of Growth

    A thorough CELL BIOTECH analysis reveals two primary drivers of its value: a dominant position in the established probiotics market and a high-potential pipeline in oncology.

    1. Global Dominance in the Probiotics Market

    For over a quarter-century, CELL BIOTECH has honed its expertise in probiotics. Its flagship ‘Dual Coating’ technology is a significant competitive advantage, protecting probiotics from stomach acid and bile salts to ensure their delivery to the gut. This innovation is the bedrock of its success, culminating in an impressive 11-year streak as the world’s #1 exporter of probiotics. This isn’t just a revenue stream; it’s a testament to the company’s quality, stability, and global trust.

    2. The Future: Oncology Drugs and Microbiome Innovation

    The most exciting catalyst for future growth is the company’s foray into oncology drugs. The anti-cancer drug candidate, PP-P8, represents a paradigm shift, leveraging the microbiome to potentially treat diseases like colorectal cancer. The commencement of Phase 1 clinical trials at Seoul National University Hospital in March 2025 was a pivotal milestone. As of November 2025, patient recruitment is actively underway, a crucial step in advancing this promising therapy. The potential market for effective cancer treatments is immense, as detailed by organizations like the World Health Organization, making PP-P8 a key asset to watch.

    CELL BIOTECH’s strategy smartly combines a stable, cash-generating probiotics business with the high-growth, transformative potential of its oncology drug pipeline. This provides both a solid foundation and a significant upside for investors.

    Financial Health & Market Headwinds

    Beyond the income statement, CELL BIOTECH’s balance sheet is exceptionally robust. With a debt-to-equity ratio of just 4.91% and over 86 billion KRW in cash and short-term financial instruments, the company is well-capitalized. This financial fortitude is critical, as it allows CELL BIOTECH to fund its long-term R&D for oncology drugs like PP-P8 without relying on dilutive financing. However, the company must navigate a complex macroeconomic environment, including high interest rates that could temper investment returns and a volatile KRW/USD exchange rate, which, given its export focus, can positively impact profitability.

    Investor Outlook & Strategic Action Plan

    The CELL BIOTECH Q3 2025 earnings paint a picture of a company in a strong position but facing key inflection points. The quarter-over-quarter recovery is reassuring, but the limited year-over-year operating profit growth suggests that investments in new ventures are impacting short-term margins.

    What Investors Should Monitor:

    • Clinical Trial Progress: Any updates on the Phase 1 trial for PP-P8 will be a major stock catalyst. Positive data could significantly de-risk the pipeline.
    • Margin Expansion: Keep an eye on operating profit in upcoming quarters. Investors will want to see if the company can translate revenue growth into stronger profitability as new ventures mature.
    • Diversification Success: Monitor the growth of newer segments like the ‘Cellbiome’ service and pet-focused products. To learn more, read our analysis on the pet wellness market.

    In conclusion, CELL BIOTECH presents a compelling long-term investment case grounded in proven market leadership and transformative innovation. While short-term macroeconomic factors and R&D costs warrant consideration, the positive signals from the Q3 2025 earnings reaffirm the company’s solid growth trajectory.

    Frequently Asked Questions (FAQ)

    What were CELL BIOTECH’s key Q3 2025 financial results?

    For Q3 2025, CELL BIOTECH reported revenue of 15.4 billion KRW, operating profit of 2.2 billion KRW, and net income of 3.4 billion KRW, all showing strong improvement from the previous quarter.

    What is the status of the PP-P8 anti-cancer drug trial?

    As of November 2025, the Phase 1 clinical trial for PP-P8 is actively recruiting patients at Seoul National University Hospital after receiving IND approval earlier in the year.

    Why is CELL BIOTECH a leader in the probiotics market?

    Its globally recognized ‘Dual Coating’ technology ensures the effectiveness of its products, leading to its position as the world’s #1 exporter of probiotics for 11 consecutive years.

    (049960) CELL BIOTECH Q3 2025 Earnings Analysis: Deep Dive into Probiotic Growth & Oncology Pipeline 관련 이미지
  • (007070) GS Retail Q3 2025 Earnings & Stock Analysis: A Deep Dive for Investors

    (007070) GS Retail Q3 2025 Earnings & Stock Analysis: A Deep Dive for Investors

    As the GS Retail Q3 2025 earnings release approaches on November 10, 2025, investors are keenly watching. The upcoming Investor Relations (IR) event presents a pivotal moment for the company to address its mixed performance and outline a path forward. In a complex retail environment, GS Retail’s story is one of contrasting fortunes: robust growth in its convenience and supermarket segments versus significant headwinds in home shopping and development. This comprehensive analysis dissects the latest GS Retail financial performance, examines the macroeconomic landscape, and provides a strategic outlook to help you make informed investment decisions.

    Deep Dive: Analyzing GS Retail’s Q3 2025 Earnings Fundamentals

    The first half of 2025 painted a complex picture of GS Retail’s fundamentals. While the company managed to grow its top line, profitability took a substantial hit, revealing underlying weaknesses in key business areas. This dichotomy is central to any GS Retail stock analysis.

    Revenue Growth Amidst Profitability Challenges

    GS Retail reported a modest year-on-year revenue increase of 1.99%, reaching KRW 5,735.1 billion. This growth was primarily fueled by its core retail operations. The convenience store division (GS25) grew by 1.83%, capitalizing on the rising trend of single-person households and near-distance shopping. More impressively, the supermarket arm (GS THE FRESH) posted a strong 8.74% growth, thanks to successful strategies in quick commerce and product differentiation. However, this top-line stability was overshadowed by a steep 49.7% decline in operating profit to KRW 124.9 billion, a clear signal of margin compression and operational struggles in other segments.

    The core challenge for GS Retail isn’t generating sales, but converting that revenue into sustainable profit across its diverse portfolio. The drag from its home shopping and development businesses is a significant concern that the upcoming GS Retail investor relations call must address head-on.

    The Drag from Underperforming Segments

    The primary culprits for the profit plunge were the home shopping (GS SHOP) and development businesses. GS SHOP’s revenue fell by 4.73%, but its operating profit plummeted by an alarming 76.2% due to rising transmission fees and stiff competition. The development business swung to a deficit, contracting by 14.17% amidst a sluggish real estate market. While the company’s overall financial structure remains stable with a manageable debt-to-equity ratio, the poor performance of these divisions highlights an urgent need for strategic realignment. For more context on the broader retail market, investors often consult sources like global market analyses.

    Macroeconomic Factors and Market Environment

    GS Retail’s performance is not happening in a vacuum. Several macroeconomic trends will influence its future trajectory and are crucial for a complete GS Retail stock analysis.

    • Interest Rate Outlook: Signals of potential interest rate cuts in both the U.S. and Korea could be a tailwind. Lower rates would reduce borrowing costs for capital expenditures and could stimulate consumer spending, benefiting the retail sector.
    • Exchange Rate Volatility: A strong USD against the KRW (fluctuating in the mid-1,400s range) presents a headwind, increasing the cost of imported goods and potentially squeezing retail margins.
    • Commodity Prices: The recent downward trend in international oil prices is a positive factor, as it can lead to lower logistics and operational costs, providing some relief to the company’s bottom line.

    Key Questions for the Investor Relations Event

    The upcoming IR event is GS Retail’s opportunity to restore investor confidence. A clear and credible strategic plan could be a major catalyst for the stock. Investors should listen for answers to the following critical questions. The complete data discussed will be based on the official filing. (Official Disclosure: Click to view DART report).

    • Turnaround Plan: What is the concrete strategy to improve profitability in the home shopping segment and stabilize the development business?
    • Core Business Momentum: How will the company sustain the growth momentum in convenience stores and supermarkets while managing costs effectively?
    • Future Growth Engines: Beyond the core, what are the new growth drivers? How is GS Retail investing in ESG, digital transformation, and attracting younger demographics (Gen MZ)?

    A vague presentation could confirm the market’s fears, potentially leading to further downward pressure on the stock. Conversely, a detailed and convincing plan could mark the beginning of a recovery. For further reading, see our previous analysis of the South Korean retail sector.

    Conclusion: An Investment Crossroads

    GS Retail stands at a critical juncture. The strength of its convenience and supermarket businesses provides a stable foundation, but the deep-seated issues in other segments are a significant drag on overall profitability. The upcoming GS Retail Q3 2025 earnings call is more than just a financial report; it is a test of management’s strategic vision and execution capability. Investors should meticulously scrutinize the details presented, weigh them against the macroeconomic backdrop, and judge the realism of the company’s turnaround plan before making any investment decisions.

    (007070) GS Retail Q3 2025 Earnings & Stock Analysis: A Deep Dive for Investors 관련 이미지
  • (006800) Mirae Asset Securities Q3 2025 Earnings: A Deep Dive into Profit Miss & Stock Outlook

    (006800) Mirae Asset Securities Q3 2025 Earnings: A Deep Dive into Profit Miss & Stock Outlook

    The latest Mirae Asset Securities Q3 2025 earnings report, released on November 6, 2025, has sent a mixed message to the market, leaving investors to decipher a complex financial narrative. The preliminary results revealed a significant miss on operating profit against market consensus, yet simultaneously delivered a surprising beat on net income. This dichotomy raises critical questions about the company’s underlying health and future trajectory.

    This comprehensive Mirae Asset Securities earnings analysis will dissect these contrasting figures, explore the macroeconomic pressures at play, and provide a clear, actionable investment strategy for stakeholders evaluating their position in Mirae Asset Securities stock.

    Q3 2025 Earnings: The Official Numbers

    According to the company’s preliminary filing, the key financial metrics for the third quarter of 2025 are as follows. For a complete breakdown, investors can review the Official Disclosure on DART.

    • Revenue: KRW 6,672.4 billion (a 22.5% increase YoY)
    • Operating Profit: KRW 222.8 billion (a staggering 45.0% miss vs. market expectations)
    • Net Income: KRW 340.4 billion (a solid 12.4% beat vs. market expectations)

    The central puzzle of the Q3 2025 earnings is this: How did core operational profitability decline so sharply while the final net income remained robust? The answer lies in the details beyond the headlines.

    Unpacking the Discrepancy: Profit Miss vs. Income Beat

    Factors Behind the Operating Profit Decline

    The 45% shortfall in operating profit is the primary concern for the market. This figure reflects the core business’s health, and a miss of this magnitude suggests significant headwinds. Potential causes include a combination of internal and external factors:

    • Increased Operating Expenses: A surge in costs, perhaps related to new technology investments, marketing campaigns, or one-time provisions for potential losses, could have eroded profits.
    • Market Volatility: The securities industry is highly sensitive to market conditions. As noted in reports by major financial outlets like Bloomberg, increased interest rate and currency volatility (e.g., rising KRW/USD exchange rate) can compress trading margins and reduce fee income from investment banking (IB) activities.
    • Dampened Investor Sentiment: A cautious market environment often leads to lower trading volumes and reduced demand for financial products, directly impacting a securities firm’s primary revenue streams.

    The Silver Lining in Net Income

    Conversely, the outperformance in net income suggests robust non-operating activities. Net income is calculated after accounting for non-operating gains/losses and taxes. The positive result likely stemmed from:

    • Gains on Financial Assets: Successful valuation gains on long-term investments or equity holdings can significantly boost the bottom line, even if core operations struggle.
    • Favorable Foreign Exchange Movements: While currency volatility can hurt operations, it can also create gains on foreign-denominated assets held by the company.
    • Tax-Related Adjustments: One-off corporate tax effects or refunds can also contribute to a stronger-than-expected net income figure.

    Future Outlook and Investor Action Plan

    While the short-term market reaction to the operating profit miss may be negative, a mid-to-long-term perspective requires a more nuanced approach. Investors should focus on the following key areas when evaluating the Mirae Asset Securities Q3 2025 earnings and planning their next steps.

    Key Points for Investors to Monitor

    • Analyze the Full Report: Wait for the detailed earnings report to clarify the exact reasons for the operating profit decline. Determine if the causes are one-time events or indicative of a structural weakness in the business model.
    • Track Growth Initiatives: Pay close attention to the progress of Mirae Asset’s strategic initiatives, such as its ventures into AI-powered asset management and tokenized securities (STOs). The success of these future growth engines is critical for long-term value creation. For more context, you can read our guide on diversification in financial services.
    • Evaluate Shareholder Returns: Monitor the company’s commitment to its shareholder return policy. Consistent dividends and share buyback programs can provide a buffer and enhance investment appeal, even during periods of operational volatility.
    • Monitor Macro Trends: Keep a close eye on key macroeconomic indicators. The path of global interest rates, currency fluctuations, and overall economic health will continue to be the primary drivers of performance in the securities sector.

    In conclusion, the Q3 2025 results present a complex picture. The weakness in core operations is a clear red flag that warrants caution. However, the resilient net income and the company’s forward-looking strategies provide a basis for cautious optimism. A prudent investor will dig deeper into the forthcoming detailed report before making any significant adjustments to their investment strategy regarding Mirae Asset Securities stock.

    (006800) Mirae Asset Securities Q3 2025 Earnings: A Deep Dive into Profit Miss & Stock Outlook 관련 이미지
  • (234340) Hecto Financial Q3 Earnings Analysis: Profit Beat Masks Revenue & Debt Concerns

    (234340) Hecto Financial Q3 Earnings Analysis: Profit Beat Masks Revenue & Debt Concerns

    The latest Hecto Financial earnings analysis for Q3 2025 reveals a complex picture for investors. While the FinTech company announced provisional results showing operating and net profits that surpassed market expectations, a deeper dive into the numbers uncovers persistent challenges that could impact its long-term growth trajectory. Does this positive quarter signal a genuine turnaround, or is it a temporary reprieve from more fundamental issues?

    This comprehensive report breaks down the Hecto Financial Q3 performance, evaluating the company’s fundamentals, financial health, and competitive landscape. We will explore whether the recent profitability is sustainable and what investors should monitor moving forward to make informed decisions about their Hecto Financial stock holdings.

    Hecto Financial’s Q3 2025 Earnings: A Detailed Breakdown

    For the third quarter of 2025, Hecto Financial reported a welcome beat on its profitability metrics, offering a short-term boost to market sentiment. However, the top-line revenue figure continues to be a point of concern. The full details can be found in the official filing (Source: Official DART Disclosure).

    • Revenue: Reported at KRW 45.8 billion, a 1.0% miss against the KRW 46.2 billion estimate. While this represents a slight sequential increase, it fails to reverse the troubling downward trend observed since 2022.
    • Operating Profit: A bright spot at KRW 4.5 billion, which is a significant 7.1% beat over the KRW 4.2 billion estimate. This marks an improvement both quarter-over-quarter and year-over-year, suggesting a potential bottoming-out process after the Q4 2024 low.
    • Net Profit: Reached KRW 4.0 billion, a 3.0% beat on estimates of KRW 3.9 billion. The strength in operating profit flowed directly to the bottom line, showing a substantial sequential improvement.

    While the market may celebrate the profit beat, the persistent revenue decline is a critical red flag that questions the sustainability of this recovery. True long-term growth for Hecto Financial must come from the top line.

    Core Business Strengths and Future Growth Engines

    At its core, Hecto Financial is a player in the competitive world of FinTech payment services. Understanding its foundation and future bets is key to a complete Hecto Financial earnings analysis.

    Established Competitive Advantages

    The company’s primary revenue streams—virtual accounts, firm banking, and Payment Gateway (PG) services—are supported by a strong competitive moat built on several pillars:

    • First-Mover Advantage: Early entry into the simple cash payment market has established strong brand recognition and a loyal user base.
    • Technological Superiority: Decades of experience in bank system operations have cultivated deep technical expertise.
    • Robust Security: A key differentiator in FinTech, with 24/7 real-time monitoring and dual-operated systems to ensure stability and trust.

    Venturing into New Territories

    To combat slowing growth, Hecto Financial is expanding its horizons into high-potential areas, though these come with their own uncertainties. These include data-driven businesses like MyData and an ambitious entry into the Security Token Offering (STO) market. While STOs offer a pathway to innovate in capital markets, their success is heavily dependent on a clear and favorable regulatory environment, which remains a significant variable. For more on this, read our deep dive into the evolving STO market.

    Financial Health Check: A Tale of Two Ledgers

    Despite the Q3 profit rebound, a look at Hecto Financial’s balance sheet reveals areas that warrant caution.

    • Solid Liquidity: As of mid-2025, the company boasts a healthy cash position of KRW 247.4 billion, indicating no immediate short-term liquidity risks.
    • Rising Debt Ratio: The concerning metric is the debt ratio, which surged from 92.27% in 2022 to 113.53% in 2023. This rise, coupled with declining revenue, could strain financial stability, especially if interest rates increase.
    • Macroeconomic Headwinds: While direct exposure to interest rate hikes is currently minimal due to fixed-rate borrowings, indirect effects are a risk. According to top economic analysts, shifts in oil prices and global interest rate volatility can dampen consumer sentiment, indirectly affecting transaction volumes.

    Investment Outlook: Balancing Short-Term Wins with Long-Term Risks

    In conclusion, this Hecto Financial earnings analysis paints a dual narrative. The short-term picture is encouraging, with the profit beat likely to provide temporary positive momentum for the stock.

    The Bull Case (Positive Factors)

    • Profitability Turnaround: Exceeding profit estimates is a strong signal that cost-control measures may be taking effect.
    • Strong Core Tech: The company’s underlying technology and security infrastructure remain valuable assets in the growing FinTech space.

    The Bear Case (Negative Risks)

    • Persistent Revenue Decline: The most urgent issue is the need for a sustainable revenue growth driver.
    • Deteriorating Financial Structure: The rising debt ratio is a significant concern that could limit future flexibility and increase risk.
    • New Business Uncertainty: The success of ventures like STO is not guaranteed and hinges on external regulatory factors.

    Investors should look beyond the headline profit numbers and focus on whether Hecto Financial can address its structural challenges in the upcoming quarters. Close attention should be paid to the Q4 results and any strategic plans aimed at reigniting top-line growth and improving the company’s financial leverage.

    Disclaimer: This report is based on provided information and independent analysis, and does not constitute a direct recommendation for any investment decision. Investment decisions should be made based on the investor’s own judgment and responsibility.

    (234340) Hecto Financial Q3 Earnings Analysis: Profit Beat Masks Revenue & Debt Concerns 관련 이미지
  • (383800) LX Holdings Corp. Q3 Earnings Miss: In-Depth Analysis & 2025 Stock Strategy

    (383800) LX Holdings Corp. Q3 Earnings Miss: In-Depth Analysis & 2025 Stock Strategy

    The latest LX Holdings Corp. Q3 earnings report for 2025 has arrived, and the numbers have sent a clear signal to the market: caution is warranted. With key profitability metrics falling nearly 20% below analyst expectations, investors are understandably concerned. Is this a temporary dip caused by market headwinds, or does it point to more fundamental challenges within the company’s core subsidiaries?

    This comprehensive analysis will dissect the official Q3 results, explore the multifaceted reasons behind the LX Holdings earnings miss, and evaluate the potential impact on the LX Holdings stock price. Most importantly, we will outline actionable investment strategies to help you navigate this period of uncertainty with confidence.

    Dissecting the LX Holdings Corp. Q3 Earnings Report

    On November 5th, LX Holdings Corp. released its preliminary consolidated financial results, revealing a significant deviation from market consensus. The official figures, based on the company’s public filing (Source: Official Disclosure), paint a challenging picture.

    The 19% miss in both operating profit and net income is a critical deviation that the market cannot ignore. It immediately raises questions about the operational health of its key subsidiaries.

    Key Financial Metrics for Q3 2025

    • Revenue: KRW 11.1 billion (Market estimate was not available for direct comparison).
    • Operating Profit: KRW 37.3 billion, which is 19% below the market estimate of KRW 45.8 billion.
    • Net Income: KRW 37.6 billion, also missing the estimate of KRW 46.3 billion by 19%.

    Operating profit is a crucial indicator of a company’s core operational efficiency. A miss of this magnitude suggests that the primary business activities faced significant profitability pressures during the quarter.

    Why the Miss? A Deep Dive into the Underlying Causes

    As a holding company, LX Holdings Corp.’s performance is a direct reflection of its subsidiaries. The Q3 shortfall was not due to a single issue but a convergence of sector-specific challenges and broader macroeconomic headwinds. For more information on global economic trends, investors often consult authoritative sources like Bloomberg’s market analysis.

    1. Headwinds at LX International

    • Logistics Pressure: The Shanghai Containerized Freight Index (SCFI), a key barometer for shipping rates, experienced high volatility, negatively impacting logistics margins.
    • Commodity and Trading Volatility: Fluctuations in key commodity prices, including crude oil (CLcv1) and other raw materials, combined with falling LCD panel prices, likely squeezed profits in the trading division.

    2. Cyclical Downturn for LX Semicon

    The semiconductor industry is famously cyclical. The recent global slowdown in demand for consumer electronics has created a challenging environment. This likely led to reduced demand for LX Semicon’s primary product, Driver-ICs, which are essential components for displays in smartphones and TVs.

    3. Macroeconomic Pressures

    • Adverse Exchange Rates: A strengthening Korean Won against major currencies like the USD and Euro can make Korean exports more expensive and less competitive on the global stage, impacting revenue and profit when converted back to KRW.
    • Sustained High-Interest Rates: Elevated interest rates in key markets like the U.S. and Europe increase borrowing costs and can suppress global consumer demand for high-ticket items, indirectly affecting LX’s entire value chain.

    Actionable Investment Strategy for LX Holdings Corp. Stock

    Given the disappointing LX Holdings Corp. Q3 earnings, a reactive sell-off is likely. However, prudent investors should focus on a structured LX Holdings investment strategy. Understanding the nuances of holding companies is key; for more on this topic, see our guide on How to Analyze Conglomerate Stocks.

    • Re-evaluate Fair Value: The earnings miss necessitates a downward revision of valuation models. Investors should conservatively re-calculate the stock’s fair price using methods like Price-to-Earnings (P/E) comparison with industry peers or a Discounted Cash Flow (DCF) analysis.
    • Scrutinize Subsidiary Reports: Dive deep into the individual Q3 reports of LX International, LX Semicon, and LX MMA. Look for management’s commentary on future outlooks and any signs of stabilization or recovery in their respective sectors.
    • Monitor Macro Indicators: Keep a close watch on the key external factors: exchange rates, interest rate decisions by central banks, and commodity indices. These will be leading indicators for LX’s performance in the coming quarters.
    • Focus on Long-Term Growth Catalysts: Beyond the short-term noise, assess the progress of new growth initiatives. The success of LX Semicon’s push into thermal substrates and LX International’s strategic investments in nickel are crucial for long-term value creation. These ventures could be significant drivers for future LX Holdings stock appreciation.

    Frequently Asked Questions (FAQ)

    Q1: What were the key results of the LX Holdings Corp. Q3 earnings?

    LX Holdings Corp. reported a Q3 2025 operating profit of KRW 37.3 billion and net income of KRW 37.6 billion, both falling approximately 19% short of market expectations.

    Q2: Why did LX Holdings miss its earnings target?

    The miss was caused by a mix of factors, including weak logistics freight rates and trading performance at LX International, a cyclical downturn in the semiconductor market affecting LX Semicon, and macroeconomic pressures like adverse exchange rates and high interest rates.

    Q3: What is the expected short-term impact on LX Holdings stock?

    A significant earnings miss typically leads to negative investor sentiment and is likely to cause downward pressure on the stock price in the short term as the market digests the news.

    Q4: What is the long-term outlook for LX Holdings?

    The long-term outlook depends on the recovery of its subsidiaries’ core businesses and, more importantly, the successful execution of its new growth strategies, such as investments in nickel resources and the expansion of its thermal substrate business.

    (383800) LX Holdings Corp. Q3 Earnings Miss: In-Depth Analysis & 2025 Stock Strategy 관련 이미지
  • (039130) HANATOUR Earnings (039130) Miss in Q3 2025: An In-Depth Stock Analysis for Investors

    (039130) HANATOUR Earnings (039130) Miss in Q3 2025: An In-Depth Stock Analysis for Investors

    The latest HANATOUR earnings report for Q3 2025 has sent ripples of concern through the investment community. Despite a backdrop of recovering global travel, HANATOUR SERVICE INC. (039130) delivered provisional results that fell short of market expectations, particularly a significant miss in net profit. This unexpected outcome suggests increased short-term downward pressure on the HANATOUR stock price and raises critical questions about the company’s profitability and future trajectory.

    This comprehensive (039130) analysis will dissect the Q3 performance, explore the underlying factors behind the earnings miss, evaluate the potential impact on stock prices, and provide a strategic action plan for investors navigating this uncertainty. Let’s delve into what these numbers mean for Hanatour’s position in the competitive travel landscape.

    Deconstructing the Q3 2025 Provisional Results

    On November 5, 2025, Hanatour announced its provisional results, revealing a disconnect between operational performance and market consensus. The official figures, which can be verified in the Official Disclosure on DART, show a clear miss in key financial metrics.

    • Revenue: KRW 123.3 billion (6% below the estimate of KRW 130.7 billion)
    • Operating Profit: KRW 8.3 billion (1% below the estimate of KRW 8.4 billion)
    • Net Profit: KRW 7.7 billion (a significant 21% miss versus the estimate of KRW 9.8 billion)

    The most alarming figure is the net profit, which dramatically undershot expectations. While operating profit was nearly in line, it still represents a year-over-year decrease from Q3 2024’s KRW 12 billion. This signals that even as travel demand returns, Hanatour is struggling to convert top-line activity into bottom-line profit, a key concern for investors analyzing travel industry stocks.

    Why Did the HANATOUR Earnings Miss Expectations?

    The disappointing Q3 2025 earnings were not the result of a single issue, but rather a confluence of external pressures and internal challenges.

    Macroeconomic Headwinds and Industry Pressures

    While stable interest and exchange rates provided some relief, the travel sector remains highly sensitive to global volatility. According to recent industry reports from Skift, rising operational costs are a major concern. For Hanatour, volatile oil prices directly impact airfare costs, while higher freight indices burden logistics. These external cost pressures have evidently squeezed profit margins despite the industry’s post-pandemic recovery tailwinds.

    Fundamental Strengths and Weaknesses

    A deeper look at Hanatour’s fundamentals reveals a mixed picture:

    • Positives: The company is well-positioned to benefit from long-term tourism recovery. Strategic initiatives, including cost-efficiency programs, shareholder-friendly actions like treasury stock cancellation, and investments in new IT and location-based services, show a forward-looking approach.
    • Risks: Persistent revenue decline, a high debt-to-equity ratio, and intensifying competition from both traditional and digital-native travel agencies are significant concerns. Furthermore, the company remains exposed to macroeconomic shocks and potential litigation risks.

    Stock Price Outlook and Investor Sentiment

    The immediate reaction to the earnings miss is likely to be negative for the HANATOUR stock. Selling pressure is anticipated as the market digests the 21% net profit shortfall, which could erode investor confidence and reinforce a more conservative outlook on future performance.

    In the mid-to-long term, the market will shift its focus from this single quarter to a broader reassessment of Hanatour’s fundamental recovery narrative. The key question will be whether this is a temporary setback or a sign of deeper structural issues.

    The success of new ventures and the company’s ability to defend its market share will be critical catalysts for a potential rebound. As a bellwether for the Korean travel market, Hanatour’s performance could also dampen sentiment across the wider sector. Investors can read our analysis of the broader travel industry outlook for 2026 to understand these trends better.

    Investor Action Plan: Maintain ‘Neutral’ and Monitor Closely

    Given the conflicting signals—a recovering industry versus weakening profitability—a ‘Neutral’ investment stance is prudent. However, passive waiting is not enough. Active monitoring of several key indicators is essential to identify the next inflection point:

    • Q4 Earnings & Guidance: Scrutinize the next report for signs of a profitability turnaround.
    • Margin Improvement: Look for concrete evidence that cost-control strategies are working.
    • New Business Traction: Track the revenue contribution and growth of new IT and location-based service ventures.
    • Competitive Positioning: Monitor market share data against competitors like Mode Tour and emerging online travel agencies.

    Frequently Asked Questions (FAQ)

    Q1: How did HANATOUR’s Q3 2025 earnings perform against expectations?

    A1: Hanatour’s Q3 2025 earnings fell short of market expectations. Revenue was 6% below estimates, while net profit missed by a significant 21%.

    Q2: What is the expected short-term impact on the HANATOUR stock price?

    A2: A negative short-term impact is anticipated, with downward pressure on the stock price due to the substantial net profit miss and weakened investor confidence.

    Q3: What are the main factors behind Hanatour’s underperformance?

    A3: Key factors include macroeconomic pressures like high oil prices squeezing margins, intensifying market competition, a high debt-to-equity ratio, and a general failure to translate recovering travel demand into strong net profit.

    (039130) HANATOUR Earnings (039130) Miss in Q3 2025: An In-Depth Stock Analysis for Investors 관련 이미지
  • (069960) HYUNDAI DEPARTMENT STORE Earnings (Q3 2025): A Deep Financial Analysis for Investors

    (069960) HYUNDAI DEPARTMENT STORE Earnings (Q3 2025): A Deep Financial Analysis for Investors

    The latest HYUNDAI DEPARTMENT STORE earnings report for Q3 2025 has sent ripples through the market, revealing a performance that fell short of analyst expectations. For investors, this moment presents a critical juncture: is this a temporary stumble for a retail giant, or a sign of deeper structural challenges? This comprehensive HYUNDAI DEPARTMENT STORE financial analysis will dissect the numbers, explore the underlying causes, and provide a forward-looking perspective to help you navigate the crisis and identify potential opportunities.

    As a cornerstone of South Korea’s retail landscape, the performance of HYUNDAI DEPARTMENT STORE CO.,LTD is often seen as a barometer for consumer health. The Q3 2025 results, with misses on both revenue and profit, demand a closer look at the company’s strategy, its resilience against macroeconomic headwinds, and its roadmap for future growth.

    Unpacking the Q3 2025 Earnings Report

    The provisional results for Q3 2025 painted a concerning picture, with key metrics failing to meet the market consensus. Let’s break down the official figures to understand the scale of the challenge. For a detailed breakdown, investors can consult the Official Disclosure (DART).

    Key Financial Metrics vs. Expectations

    • Revenue: Reported KRW 1,010.3 billion, missing the market’s expectation of KRW 1,016.9 billion. This represents a 2.5% decrease year-over-year and continues a downward trend seen throughout 2025.
    • Operating Profit: Came in at KRW 72.6 billion, a significant 7% below the consensus of KRW 78.4 billion. While up 12.4% from the prior year, the operating profit margin has worryingly declined from its Q1 peak.
    • Net Profit: At KRW 45.2 billion, it missed expectations by 3% and showed a sharp decline from the previous two quarters, highlighting pressure from non-operating factors.

    The persistent revenue decline since the start of the year, culminating in a year-over-year drop in Q3, signals a fundamental weakening in consumer spending and raises questions about the long-term growth trajectory of traditional department store channels.

    Forces Behind the Slump: Macro Pressures and Sector Challenges

    The disappointing HYUNDAI DEPARTMENT STORE earnings are not occurring in a vacuum. A combination of broad economic headwinds and industry-specific challenges are contributing to the decline. As reported by sources like Reuters, global inflation and interest rate policies are squeezing consumer disposable income worldwide.

    Weakening Consumer Sentiment and Fierce Competition

    The core department store division is facing a perfect storm. Rising interest rates and inflation are forcing households to cut back on discretionary spending, which directly impacts luxury and high-end retail. Simultaneously, the relentless growth of e-commerce continues to erode market share from brick-and-mortar establishments. To learn more, you can read our analysis of South Korea’s retail sector trends. This dual pressure makes it difficult to sustain revenue growth without significant innovation in customer experience and online integration.

    Adverse Macroeconomic Environment

    • Currency Fluctuations: A rising KRW/USD exchange rate negatively impacts divisions with overseas operations, such as the ZINUS furniture segment, by increasing import costs for raw materials and affecting sales conversion.
    • Interest Rate Burden: While benchmark rates have stabilized, elevated government bond yields can increase borrowing costs for future investments and expansion projects, adding a layer of financial risk.
    • High Debt Ratio: A projected debt-to-equity ratio of 114.65% is a significant concern, especially in a rising rate environment, as it can strain financial flexibility and amplify risks.

    Investor Outlook: Strategy and Key Recommendations

    Given the challenges, the path forward for HYUNDAI DEPARTMENT STORE requires bold, decisive action. For investors, the key is to monitor whether the company’s strategic responses can effectively counteract the negative trends and unlock value in its diverse portfolio.

    Pathways to Recovery and Growth

    To enhance shareholder value and secure a sustainable future, management should focus on several key areas. The performance of the HYUNDAI DEPARTMENT STORE stock will likely depend on successful execution in these domains:

    • Core Business Innovation: The department store division must evolve. This means strengthening its online-to-offline (O2O) strategy, creating unique experiential retail content, and curating merchandise that resonates with modern consumer lifestyles.
    • Profitability and Efficiency: With revenue under pressure, a rigorous focus on cost efficiency is paramount. This includes reducing fixed costs, optimizing the supply chain, and improving capital structure to mitigate financial risks.
    • Diversified Growth Engines: The positive momentum in the Duty-Free and ZINUS divisions must be nurtured. Successful new store openings (e.g., The Hyundai Gwangju) will also be crucial for reigniting growth.
    • Transparent Communication: Restoring investor confidence requires clear and proactive communication about the turnaround strategy and measurable milestones for its implementation.

    In conclusion, the Q3 2025 HYUNDAI DEPARTMENT STORE earnings serve as a critical wake-up call. While significant headwinds exist, the company possesses strong assets and potential growth drivers. Investors should closely watch for signs of strategic execution and fundamental improvements in the quarters to come.

    (069960) HYUNDAI DEPARTMENT STORE Earnings (Q3 2025): A Deep Financial Analysis for Investors 관련 이미지
  • (041510) SM Entertainment Earnings (Q3 2025): Profit Soars Despite Revenue Dip – A Deep Dive for Investors

    (041510) SM Entertainment Earnings (Q3 2025): Profit Soars Despite Revenue Dip – A Deep Dive for Investors

    The latest SM Entertainment earnings report for Q3 2025 presents a fascinating paradox for investors and industry analysts. As a titan in the global K-POP market, the company reported a slight dip in revenue that missed market expectations. However, in a surprising turn, both operating and net profits surged past forecasts, signaling a significant and positive strategic shift. How did SM Entertainment orchestrate this impressive boost in profitability against a backdrop of declining sales? And what does this pivot reveal about the company’s future growth trajectory and the potential for the SM Entertainment stock?

    This comprehensive analysis delves deep into SM’s financial health, unpacking the Q3 2025 provisional results and its first-half performance to provide a clear, data-driven perspective for your investment decisions.

    SM Entertainment Q3 2025: A Tale of Two Metrics

    On November 5, 2025, SM Entertainment released its provisional consolidated financial results, capturing the market’s full attention. While top-line growth faltered, the bottom-line performance told a story of resilience and operational excellence. Here are the key figures from the report:

    • Revenue: KRW 321.6 billion, which was 2% below the market forecast of KRW 329.6 billion.
    • Operating Profit: KRW 48.2 billion, beating the market forecast of KRW 47.7 billion by 1%.
    • Net Profit: KRW 39.8 billion, a significant 6% beat over the forecast of KRW 37.4 billion.

    This outperformance in profitability, despite revenue headwinds, suggests that the company’s internal strategic adjustments are beginning to yield substantial results, creating a positive surprise for the market.

    The ‘Why’ Behind the Numbers: Strategy Over Sales

    The divergence between revenue and profit wasn’t accidental. It was the result of deliberate strategic choices aimed at building a more resilient and efficient business model. Several key factors contributed to this successful turnaround in the SM Entertainment earnings profile.

    The DearU Co., Ltd. Power Play

    A core pillar of this new strategy is the amplified focus on the high-margin fandom platform business. By increasing its stake in DearU Co., Ltd. to 55.63% and consolidating it as a subsidiary, SM has secured a powerful engine for recurring revenue. Fandom platforms like DearU’s ‘Bubble’ are less susceptible to the cyclical nature of album releases and concerts, providing a stable, high-profitability income stream by monetizing the artist-fan connection directly.

    Leaner Operations and Synergistic Mergers

    Internally, SM has been focused on enhancing organizational efficiency. The strategic merger and absorption of affiliates like Studio Realive Co., Ltd. and SM Studios Co., Ltd. are designed to eliminate redundancies, reduce overhead costs, and create a more streamlined content production pipeline. These long-term moves are now visibly impacting the bottom line by improving operating margins.

    SM Entertainment’s Q3 results demonstrate a critical pivot: from a pure top-line growth model to a more sophisticated, profitability-focused strategy. This is a sign of a mature company adapting to a new market reality.

    Navigating the Competitive K-POP Market and Global Headwinds

    The revenue slowdown is not occurring in a vacuum. A comprehensive K-POP market analysis reveals intensifying competition, both domestically and internationally. A global economic slowdown has also tempered consumer spending on merchandise and concerts. Experts at leading publications like Billboard have noted the increasing saturation in the idol market, forcing companies to innovate beyond traditional revenue models. Furthermore, macroeconomic factors like fluctuating interest rates and currency exchange rates add another layer of complexity, impacting everything from borrowing costs to the value of overseas earnings.

    For a deeper look into the competitive landscape, explore our complete K-POP industry overview for 2025. The company’s ability to navigate these external pressures while improving internal efficiency will be key to its sustained success.

    Investor Action Plan: What to Watch Next

    For those considering an investment in SM Entertainment stock, the Q3 results provide a new lens through which to evaluate the company. The focus should shift from pure revenue growth to the sustainability of this newfound profitability. Here are critical points to monitor:

    • Revenue Rebound: Watch for signs that the decline in core entertainment revenue is stabilizing or beginning to recover in the coming quarters.
    • Profit Margin Sustainability: Analyze whether the improved operating and net profit margins can be maintained or even expanded in the future.
    • DearU Performance: Track the growth and profitability metrics of DearU Co., Ltd. as a key indicator of the success of the platform strategy.
    • Shareholder Returns: Keep an eye on the company’s dividend policy and other shareholder return initiatives, which could signal confidence from management.

    For a complete and unfiltered view of the financial data, investors can consult the Official Disclosure filed with the Financial Supervisory Service’s DART system. SM Entertainment is at a crucial inflection point, and evaluating its strategic execution will be paramount for any long-term investment thesis.

    (041510) SM Entertainment Earnings (Q3 2025): Profit Soars Despite Revenue Dip – A Deep Dive for Investors 관련 이미지
  • (095340) ISC Earnings Analysis: Why AI Semiconductor Test Socket Dominance Outweighs Q3 Miss

    (095340) ISC Earnings Analysis: Why AI Semiconductor Test Socket Dominance Outweighs Q3 Miss

    The latest preliminary Q3 2025 earnings report from ISC Co., LTD. (ISC) initially caused a stir, with figures falling short of market consensus. But for savvy investors, this moment warrants a deeper look beyond the headline numbers. Is this a sign of weakness, or a temporary pause in a long-term growth story fueled by the AI revolution? At the heart of this story is ISC’s commanding position in the critical AI semiconductor test socket market, a non-negotiable component for the future of technology.

    This comprehensive analysis unpacks ISC’s financial performance, explores its unshakeable market leadership, and evaluates the powerful tailwinds and potential risks on the horizon. We’ll provide a clear perspective on why ISC’s fundamental strengths present a compelling long-term thesis.

    Decoding the Q3 2025 Earnings Report

    ISC Co., LTD. released its preliminary financial results for the third quarter of 2025, which, while showing growth, did not meet the high expectations set by analysts. This created some short-term market volatility. For a detailed breakdown of the financials, you can review the Official Disclosure filed with DART.

    Key Performance Summary vs. Expectations

    • Revenue: KRW 64.5 billion (Missed consensus of KRW 67.6 billion by -5.0%)
    • Operating Profit: KRW 17.4 billion (Missed consensus of KRW 18.8 billion by -7.4%)
    • Net Income: KRW 16.1 billion (Missed consensus of KRW 18.4 billion by -12.5%)

    While any miss can be disappointing, context is crucial. This performance comes after a stellar Q2 2025 where revenue and operating profit grew by over 50% quarter-over-quarter. This suggests the Q3 figures may represent a period of normalization or temporary adjustment rather than a fundamental flaw in the company’s growth engine.

    The Unwavering Core: Dominance in the AI Semiconductor Test Socket Market

    Despite the quarterly noise, ISC’s core fundamentals are stronger than ever. The company is not just a participant but a leader in the high-stakes world of semiconductor test solutions. As AI and machine learning chips become exponentially more complex, the need for sophisticated testing becomes paramount. This is where the AI semiconductor test socket, ISC’s specialty, plays an indispensable role, ensuring the reliability and performance of chips that power our digital world. For more on chip complexity, see this analysis from leading industry experts.

    ISC’s market grip is staggering. Non-memory revenue constitutes 85% of their total, with revenue from AI-related products surging to 62% in Q2. Within the generative AI hardware sector, ISC commands a near-monopolistic 95% revenue share.

    This dominance is built on unparalleled technological expertise, catering to major AI accelerator and ASIC clients. As flagship smartphones and data centers increasingly rely on advanced AI processors, demand for ISC’s high-performance test sockets is set for structural, long-term growth.

    Future Growth Drivers and Financial Stability

    ISC is not resting on its laurels. The company is actively cultivating new avenues for growth that complement its core business and fortify its market position.

    New Business Synergies

    • Acquired Businesses: Synergies with a recently acquired equipment material business are expected to streamline operations and open up new revenue streams.
    • Expanded Product Lines: The expansion into high-speed burn-in testers and module testers in the second half of the year will tap into adjacent, high-demand market segments.

    A Rock-Solid Financial Foundation

    Underpinning this growth is a remarkably stable financial structure. Operating cash flow surged to KRW 19.1 billion in the first half of 2025, and the debt-to-equity ratio sits at an exceptionally low 15.67%. This financial prudence gives ISC the flexibility to invest in R&D and navigate economic uncertainties without being over-leveraged.

    Balanced Outlook: Navigating Risks and Opportunities

    No investment is without risk. It’s crucial to monitor whether the Q3 earnings underperformance was truly temporary or signals a slowdown in market demand. Furthermore, a potential global economic slowdown, hinted at by mixed shipping rate indicators, could indirectly impact the entire semiconductor industry. Competition in the tech-intensive testing market also requires constant vigilance.

    However, these risks are balanced by favorable market conditions. Stable interest rates in the US and South Korea reduce borrowing costs, and favorable currency exchange rates positively impact ISC’s export-heavy business model. Most importantly, the AI trend is a powerful secular force that is likely to override cyclical economic downturns.

    Investor Takeaway: A Long-Term Vision

    The Q3 2025 ISC earnings report may create short-term stock price fluctuations. However, for those with a long-term perspective, such volatility can present a strategic entry point. The core investment thesis for ISC remains intact and compelling.

    The unstoppable growth of the AI industry directly translates into sustained demand for ISC’s market-leading AI semiconductor test socket products. Investors should focus on tracking the company’s AI revenue contribution and the progress of its new business ventures. By looking past the quarterly noise and focusing on the powerful fundamentals and structural growth story, one can formulate a wise and prudent investment strategy. To learn more about this sector, read our Guide to Investing in the AI Hardware Boom.

    (095340) ISC Earnings Analysis: Why AI Semiconductor Test Socket Dominance Outweighs Q3 Miss 관련 이미지